. 2021 Sep 8:12:674276.
doi: 10.3389/fimmu.2021.674276. eCollection 2021.

Generation of Pure Highly Functional Human Anti-Tumor Specific Cytotoxic T Lymphocytes With Stem Cell-Like Memory Features for Melanoma Immunotherapy

Affiliations

Generation of Pure Highly Functional Human Anti-Tumor Specific Cytotoxic T Lymphocytes With Stem Cell-Like Memory Features for Melanoma Immunotherapy

Mohamad Hamieh et al. Front Immunol. .

Abstract

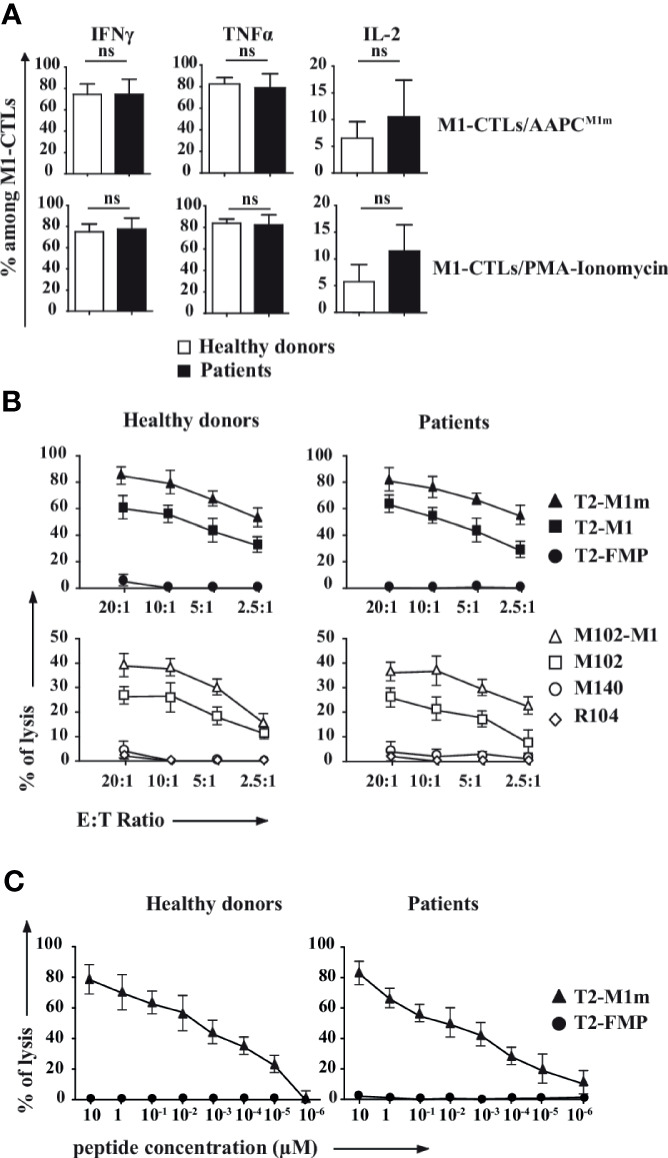
Adoptive immunotherapy based on the transfer of anti-tumor cytotoxic T lymphocytes (CTLs) is a promising strategy to cure cancers. However, rapid expansion of numerous highly functional CTLs with long-lived features remains a challenge. Here, we constructed NIH/3T3 mouse fibroblast-based artificial antigen presenting cells (AAPCs) and precisely evaluated their ability to circumvent this difficulty. These AAPCs stably express the essential molecules involved in CTL activation in the HLA-A*0201 context and an immunogenic HLA-A*0201 restricted analogue peptide derived from MART-1, an auto-antigen overexpressed in melanoma. Using these AAPCs and pentamer-based magnetic bead-sorting, we defined, in a preclinical setting, the optimal conditions to expand pure MART-1-specific CTLs. Numerous highly purified MART-1-specific CTLs were rapidly obtained from healthy donors and melanoma patients. Both TCR repertoire and CDR3 sequence analyses revealed that MART-1-specific CTL responses were similar to those reported in the literature and obtained with autologous or allogeneic presenting cells. These MART-1-specific CTLs were highly cytotoxic against HLA-A*0201+ MART-1+ tumor cells. Moreover, they harbored a suitable phenotype for immunotherapy, with effector memory, central memory and, most importantly, stem cell-like memory T cell features. Notably, the cells harboring stem cell-like memory phenotype features were capable of self-renewal and of differentiation into potent effector anti-tumor T cells. These "off-the-shelf" AAPCs represent a unique tool to rapidly and easily expand large numbers of long-lived highly functional pure specific CTLs with stem cell-like memory T cell properties, for the development of efficient adoptive immunotherapy strategies against cancers.

Keywords: MART-1/Melan-A; adoptive cell therapy; anti-tumor cytotoxic T lymphocytes; artificial antigen presenting cells; stem cell-like memory T cells.


Conflict of interest statement

The authors declare that the research was conducted in the absence of any commercial or financial relationships that could be construed as a potential conflict of interest.

Figures

Figure 1
Figure 1
AAPC-based protocol to obtain pure MART-1-specific cytotoxic T lymphocytes. (A) Scheme describing the NIH/3T3-derived AAPC-based protocol in three steps: first, at day (D) 0 of the co-culture, total TLs were co-cultured with irradiated AAPCM1m. At D21, MART-1-specific cytotoxic TLs (M1-CTLs) were purified by magnetic sorting and expanded until D35. (B–D) At D0 (B), D21 (C) and D35 (D), MART-1 expression was assessed using PE-labeled Pentamer and APC-labeled anti-CD8 (left parts). Histograms of M1-CTL percentages, TL absolute numbers and M1-CTL absolute numbers respectively (right parts) are displayed. Left parts. Representative examples of patients and healthy donors are displayed. Quadrants are placed according to isotype control staining. Relative percentages are shown in each quadrant. Right parts. Histograms were obtained from ten healthy donors (white bars) and six patients (black bars) and shown with standard errors of means. Statistical tests (t test) were performed to compare both groups. Not significant (ns): p > 0.05, *p < 0.05, **p < 0.005 (p=0.0048).
Figure 2
Figure 2
M1-CTL repertoire displays an oligoclonal response and an expansion restricted to some Vβ subfamilies. (A) Histograms of the Vβ subfamily relative percentages on purified CD8+ TLs at D0 and on M1-CTLs at D35, using FITC-, PE- or FITC-PE-labeled antibodies are displayed. Histograms were obtained from ten healthy donors (white bars) and six patients (black bars) and shown with standard errors of means. Statistical tests (t test) were performed to compare both groups. *p < 0.05, **p < 0.01. (B) Two representative examples of immunoscopes obtained with purified CD8+ TLs at D0 (upper panels) and with M1-CTLs at D35 (lower panels) for a healthy donor (left panels) and a patient (right panels) are represented. For both groups, representative examples of expanded (Vβ3), stable (Vβ8) and decreased (Vβ23) populations respectively are displayed.
Figure 3
Figure 3
M1-CTLs secrete high levels of cytotoxicity-associated molecules, and display both high cytotoxicity and functional avidity. (A) Expression of IFNγ, TNFα and IL-2 in M1-CTLs at D35 was assessed by flow cytometry in the presence of either AAPCM1m (upper panels) or PMA (1µg/ml)/ionomycin (10µg/ml, lower panels), both in the presence of brefeldin A (20µg/ml) for 4h. Histograms were obtained from ten healthy donors (white bars) and six patients (black bars) and shown with standard errors of means. Statistical tests (t tests) were performed to compare both groups. Not significant (ns): p > 0.05. (B) M1-CTL cytotoxic specific activity was assessed in standard 4-hour 51Cr release assays. Target cells were T2 cells (upper graphs) pulsed with MART-1A27L analogue peptide (M1m, squares), MART-1 native peptide (M1, triangles), or Flu Matrix Protein-derived control peptide (FMP, circles) at a peptide concentration of 10µM. Melanoma cell lines (lower graphs) HLA-A*0201+MART-1+ (M102, open squares), transfected to overexpress MART-1 (M102-M1, open triangles) were also used as target cells. HLA-A*0201-MART-1+ (M140, open circles) and HLA-A*0201+MART-1- (R104, open diamonds) cells were used as controls. Ratios of effector cells (E) per target cells (T) 20 to 1, 10 to 1, 5 to 1 and 2.5 to 1 were used in our experiments. (C) M1-CTL avidity assay was performed using T2 cells pulsed with various concentrations (from 10 to 10-6 µM) of MART-1A27L analogue peptide (M1m) as target cells. FMP was used as a control for non-specific lysis. (B, C) Graphs represent the results obtained with ten healthy donors (left graphs) and six patients (right graphs), each donor having been studied in three independent experiments. Data are represented with standard errors of means.
Figure 4
Figure 4
Phenotypic study of pure M1-CTLs at D35 reveals the presence of central memory, effector memory and stem cell-like memory T lymphocytes. (A) Representative examples of expression profiles for different families of cell surface markers on PentM1m-stained M1-CTLs obtained at D35. Cell surface markers are distributed as follows (from upper to lower graphs): differentiation state markers, activation state markers, functional inhibition markers and homing markers. Isotype control (grey line) and specific staining (black line) for the respective markers studied are shown. (B) Percentages of M1-CTLs positive for the cell surface markers represented in histograms. (C) M1-CTL CD62L/CD95 flow cytometric analyses shown for the CD45RA+ (upper right panel) and the CD45RO+ (lower right panel) fractions. Three memory T-cell subsets were defined according to the expression of CD45RA, CD45RO, CD95 and CD62L: effector memory (EM), stem cell-like memory (SCM) and central memory (CM) TLs. Relative percentages from a representative experiment are shown for each gate and quadrant. (D) M1-CTL percentages (left panel) and absolute numbers (right panel) of the three defined memory T-cell subsets (TEM, TSCM and TCM) represented in histograms. (B, D) Histograms were obtained from ten healthy donors (white bars) and six patients (black bars). (E) Comparison of CD27, CD28 and CD127 mean fluorescence intensity (MFI) staining of CD62L+ gated M1-CTLs (black profiles and bars) and CD62L- gated M1-CTLs (gray profiles and bars). Histograms were obtained from six healthy donors. Data are shown with standard errors of means. Statistical tests (t tests) were performed to compare both groups. Not significant (ns): p > 0.05, **p < 0.005.
Figure 5
Figure 5
T lymphocytes with stem cell-like and effector memory phenotypes carry different proliferative, differentiation and functional capacities. (A) Total CTLs obtained at D21 were stained with PentM1m (left panel). Purified M1-CTLs were used in TTotal condition. Fluorescence-Activated Cell Sorting (FACS)-purified CD45RA+CD62L+ and CD45RA+CD62L- M1-CTLs were described as TSCM and TEM respectively (middle panel) and amplified with AAPCM1m for 14 days. (B) M1-CTL absolute numbers obtained at the end of the co-culture (D35) from M1-CTL-derived TTotal (T(TTotal), white histogram), TEM (T(TEM), grey histogram) and TSCM (T(TSCM), black histogram) are represented. Histograms were obtained from three healthy donors and shown with standard errors of means. Statistical tests (t tests) were performed to compare both groups. Not significant (ns): p > 0.05, *p < 0.05. (C) Phenotype of T(TTotal), T(TEM), and T(TSCM) M1-CTLs. Relative percentages in a representative experiment are represented in each relevant quadrant. (D) M1-CTL cytotoxicity was assessed in standard 4-hour 51Cr release assays. Target cells were T2 cells pulsed with 10µM of MART-1A27L analogue peptide (M1m) or Flu Matrix Protein-derived peptide (FMP). Non-specific lysis was always lower than 10% and removed to obtain the specific lysis. The graph represents the results obtained with four healthy donors, each donor having been studied in three independent experiments. Data are represented with standard errors of means. Statistical tests (Friedman tests with Dunn’s post-tests) were performed to compare the different groups.

References

    1. Eddy K, Chen S. Overcoming Immune Evasion in Melanoma. Int J Mol Sci (2020) 21:8984. 10.3390/ijms21238984 - DOI - PMC - PubMed
    1. Zhou J, Shen X, Huang J, Hodes RJ, Rosenberg SA, Robbins PF. Telomere Length of Transferred Lymphocytes Correlates With In Vivo Persistence and Tumor Regression in Melanoma Patients Receiving Cell Transfer Therapy. J Immunol (2005) 175:7046–52. 10.4049/jimmunol.175.10.7046 - DOI - PMC - PubMed
    1. Vignard V, Lemercier B, Lim A, Pandolfino MC, Guilloux Y, Khammari A, et al. . Adoptive Transfer of Tumor-Reactive Melan-A-Specific CTL Clones in Melanoma Patients Is Followed by Increased Frequencies of Additional Melan-A-Specific T Cells. J Immunol (2005) 175:4797–805. 10.4049/jimmunol.175.7.4797 - DOI - PubMed
    1. Labarriere N, Gervois N, Bonnin A, Bouquie R, Jotereau F, Lang F. PBMC Are as Good a Source of Tumor-Reactive T Lymphocytes as TIL After Selection by Melan-A/A2 Multimer Immunomagnetic Sorting. Cancer Immunol Immunother (2008) 57:185–95. 10.1007/s00262-007-0361-9 - DOI - PMC - PubMed
    1. Topalian SL, Rivoltini L, Mancini M, Ng J, Hartzman RJ, Rosenberg SA. Melanoma-Specific CD4+ T Lymphocytes Recognize Human Melanoma Antigens Processed and Presented by Epstein-Barr Virus-Transformed B Cells. Int J Cancer (1994) 58:69–79. 10.1002/ijc.2910580113 - DOI - PubMed

Publication types