. 2021 Sep 8:12:711337.
doi: 10.3389/fimmu.2021.711337. eCollection 2021.

Single-Cell RNA Sequencing Identifies New Inflammation-Promoting Cell Subsets in Asian Patients With Chronic Periodontitis

Affiliations

Single-Cell RNA Sequencing Identifies New Inflammation-Promoting Cell Subsets in Asian Patients With Chronic Periodontitis

Shu-Jiao Qian et al. Front Immunol. .

Abstract

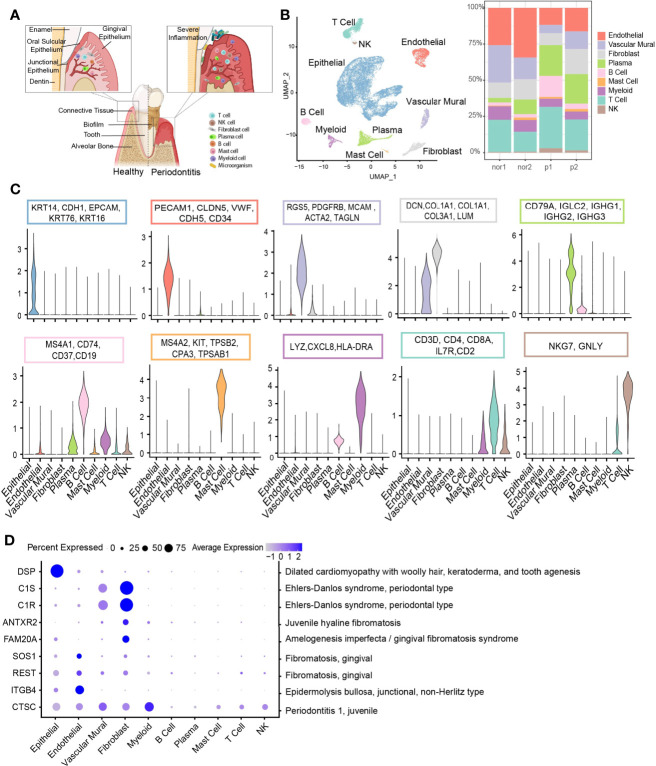
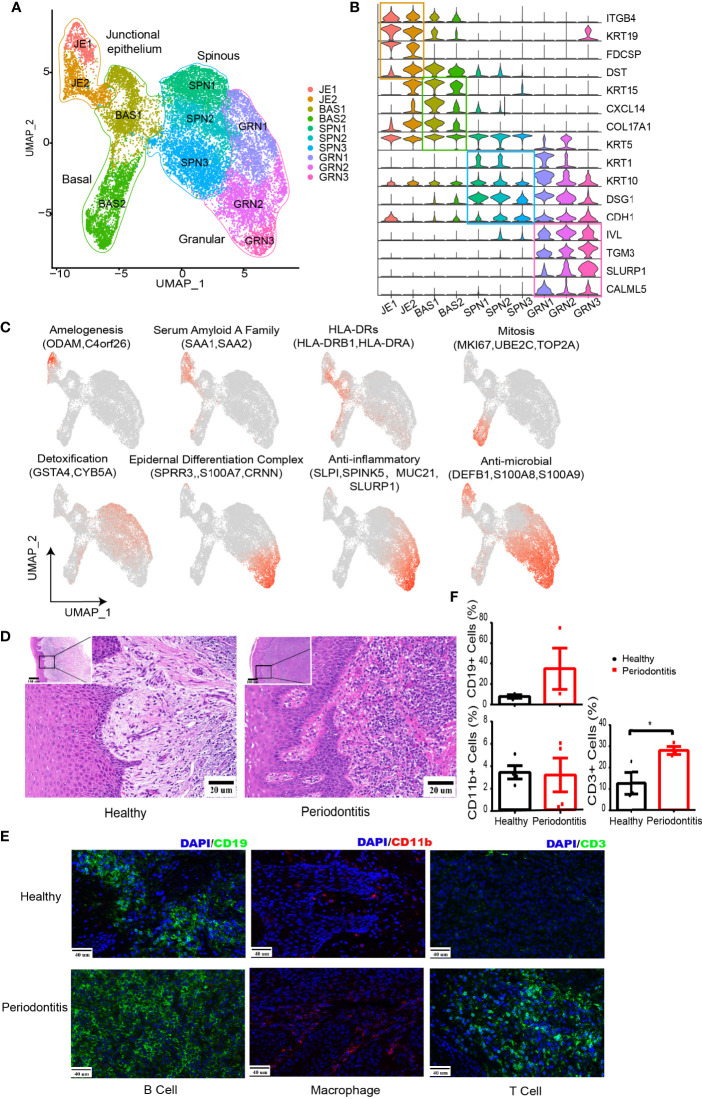
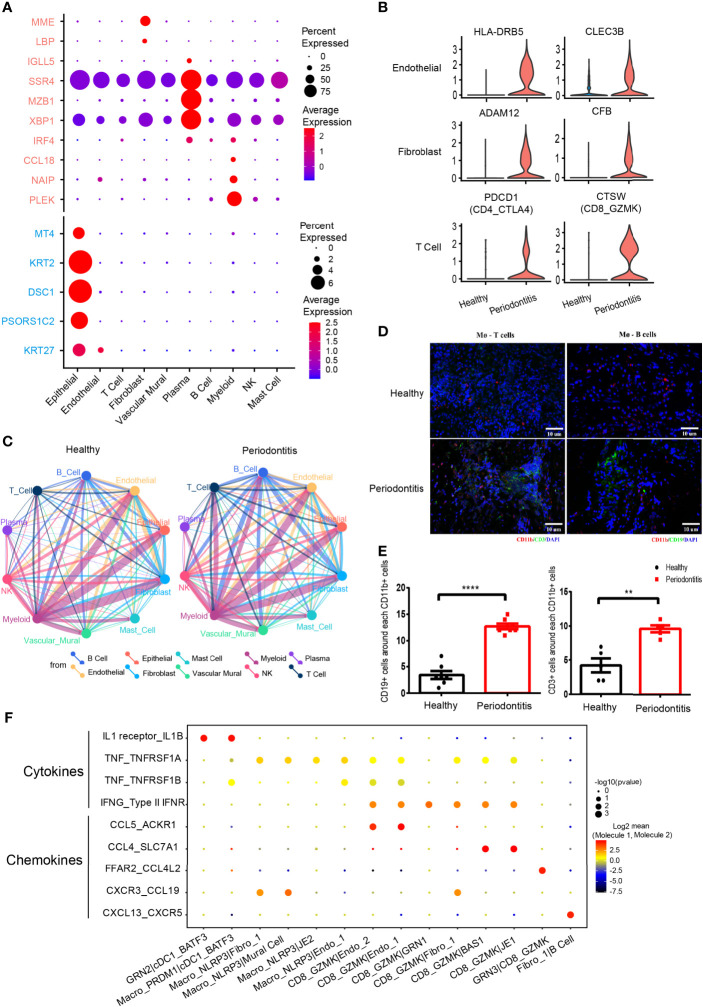
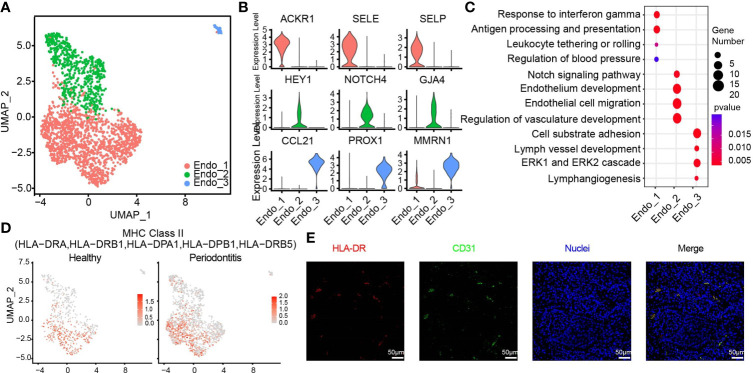
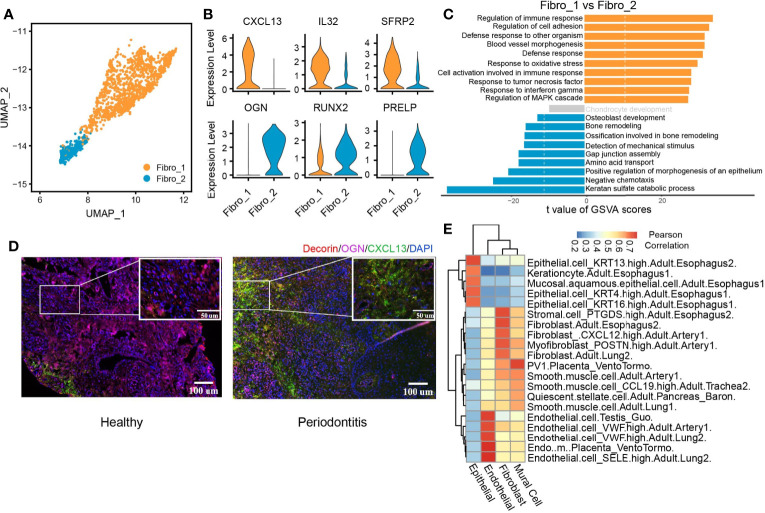
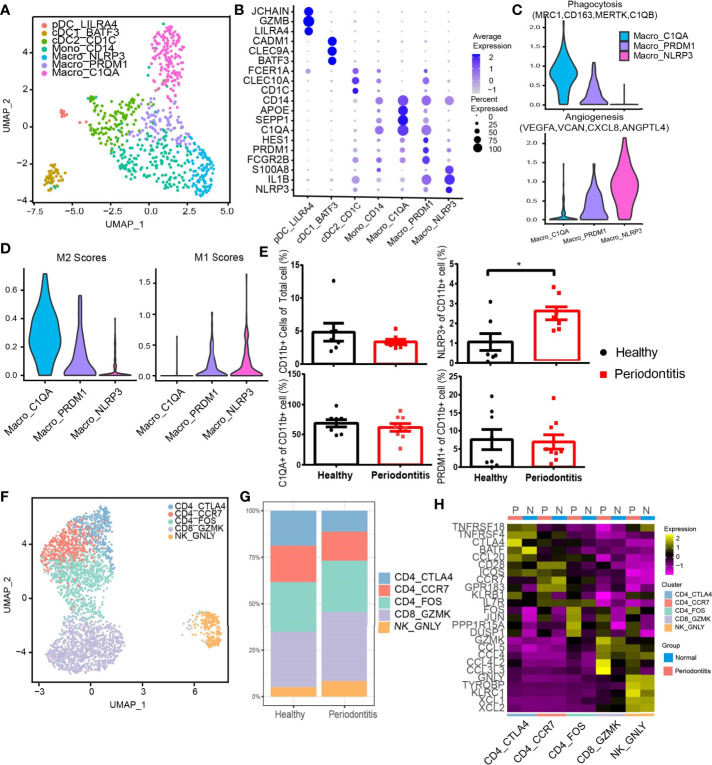
Periodontitis is a highly prevalent chronic inflammatory disease leading to periodontal tissue breakdown and subsequent tooth loss, in which excessive host immune response accounts for most of the tissue damage and disease progression. Despite of the imperative need to develop host modulation therapy, the inflammatory responses and cell population dynamics which are finely tuned by the pathological microenvironment in periodontitis remained unclear. To investigate the local microenvironment of the inflammatory response in periodontitis, 10 periodontitis patients and 10 healthy volunteers were involved in this study. Single-cell transcriptomic profilings of gingival tissues from two patients and two healthy donors were performed. Histology, immunohistochemistry, and flow cytometry analysis were performed to further validate the identified cell subtypes and their involvement in periodontitis. Based on our single-cell resolution analysis, we identified HLA-DR-expressing endothelial cells and CXCL13+ fibroblasts which are highly associated with immune regulation. We also revealed the involvement of the proinflammatory NLRP3+ macrophages in periodontitis. We further showed the increased cell-cell communication between macrophage and T/B cells in the inflammatory periodontal tissues. Our data generated an intriguing catalog of cell types and interaction networks in the human gingiva and identified new inflammation-promoting cell subtypes involved in chronic periodontitis, which will be helpful in advancing host modulation therapy.

Keywords: gingiva; inflammatory microenvironment; mucosa; periodontitis; single-cell sequencing.


Conflict of interest statement

The authors declare that the research was conducted in the absence of any commercial or financial relationships that could be construed as a potential conflict of interest.

Figures

Figure 1
Figure 1
Overview of the clustering and annotation of the single-cell RNA sequencing data for gingival tissues. (A) Schematic of gingival tissues in health (left) and periodontitis (right) analyzed in this study (The graph was created with BioRender.com). (B) UMAP representation of major cell types identified by scRNA-seq (n = 4; 29,967 cells; left) and bar plots indicating the percentage of the nonepithelial of subtypes in each donor (Nor1 and Nor2 are healthy donors; P1 and P2 are periodontitis patients; right). (C) Violin plots showing the expression scores of selected canonical marker gene sets across all 10 subsets. (D) Dot plot depicting gene expression levels and percentage of cells expressing genes associated with periodontal disease according to the OMIM database.
Figure 2
Figure 2
Changes in the microenvironment within human gingival tissue in periodontitis. (A) UMAP representation for human gingival epithelial cells in the combined health (n = 2; 18,012 cells) and periodontitis (n = 2; 502 cells) dataset. (B) Violin plots showing expression levels of cluster-defining genes for epithelial subsets. Expression values are normalized and scaled averages. (C) UMAP plots displaying functional molecule scores in the epithelial cells of all subpopulations. Red indicates maximum expression, and grey indicates low or no expression of each particular set of genes in log-normalized UMI counts. (D) H&E staining of the representative gingival tissue from health (left) and periodontitis (right) sections. Scale bar: 20 μm. (E) Representative immunofluorescence (IF) staining for CD19+ B cells (green, one column), CD11b+ macrophages (red, two columns), and CD3+ T cells (green, three columns) with DAPI (blue) in gingival sections of healthy (top) and periodontitis patients (bottom). Images were acquired at ×40 magnification (scale bar: 40 µm). (F) Bar graphs demonstrate percentage of CD19+ B cells (left top), CD11b+ macrophages (left bottom), and CD3+ T cells (right bottom) in gingival sections of healthy (n = 4) and periodontitis patients (n = 4) based on immunofluorescence analysis. The number of cells is counted based on five different limited areas on a slide from one sample then the mean was calculated. One dot per individual. Small horizontal lines indicate the mean (± s.d.). *p ≤ 0.05, as determined by Student’s t-test.
Figure 3
Figure 3
Differentially expressed genes and cell-cell interactions in health and periodontitis. (A) Bubble heatmap showing cellular expression patterns of genes associated with periodontitis based on previous bulk RNA sequencing. Rose stands for reported upregulated genes in periodontitis, and turquoise stands for reported downregulated genes in periodontitis. Dot size indicates fraction of expressing cells, colored according to z-score-normalized expression levels. (B) Violin plots showing the expression of specifically increased genes in different cell clusters in periodontitis. The gene expression levels are normalized and transformed as ln (CPM/10). (C) Cell-cell interaction network in health and periodontitis. Colors and widths of edges represent number of interaction pairs between cell types. (D) Immunofluorescent (IF) staining of T/B cell and macrophages. Red shows the signal of CD11b staining (macrophage marker); green shows the signal of CD3 (T-cell marker) at left and the signal of CD19 (B-cell marker) at right; and blue shows DAPI staining. (E) The number of CD3+ cells around each CD11b+ cell at left and the number of CD19+ cells around each CD11b+ cell at right (healthy donors, n = 5–7; patients, n = 5–7). The number of T/B cells within a limited distance of a macrophage cell is counted then the mean was calculated. One dot per individual. Small horizontal lines indicate the mean (± s.d.). **p ≤ 0.01, ****P < 0.0001 as determined by Student’s t-test. (F) Dot plot of the interaction between cytokine/chemokine and their receptors in selected subcell types of periodontitis. Size of spot indicates significance (−log10(p-value)). Color indicates expression levels (log2 mean (molecule 1–molecule 2).
Figure 4
Figure 4
HLA-DR expressing endothelial subcluster in human gingiva. (A) UMAP visualization of endothelial subclusters in the combined health (n = 2; 596 cells) and periodontitis (n = 2; 1,363 cells) dataset. (B) Violin plots showing expression levels of cluster-defining genes for endothelial subsets. Expression values are normalized and scaled averages. (C) Dot plots showing the enriched gene ontology biological process terms for each endothelial cluster. (D) The expression of HLA-DR was projected on the UMAP plot. Red indicates maximum gene expression, while grey indicates low or no expression. The gene expression levels are normalized and transformed as ln (CPM/10). (E) Immunofluorescence assay for the MHC class II marker HLA-DR (red) and the endothelial cell marker PECAM1 (CD31, green) and with DAPI (blue) in the subepithelial region. Scale bar: 50 μm.
Figure 5
Figure 5
CXCL13+ fibroblast subcluster associated with immune response. (A) UMAP visualization of two fibroblast subclusters in the combined health (n = 2; 244 cells) and periodontitis (n = 2; 1,260 cells) dataset. (B) Violin plots showing the expression distribution of selected genes associated with functions in the fibroblast clusters. The gene expression levels are normalized and transformed as ln (CPM/10). (C) Differences in pathway activities scored per cell by GSVA between fibro_1 and fibro_2. Shown are t values from a linear model, corrected for fibro_1. (D) Immunofluorescent (IF) staining validation of fibroblast subtypes. Red shows the signal of decorin staining (fibroblast marker); green shows the signal of CXCL13 staining; purple shows the signal of osteoglycin (OGN), and blue shows DAPI staining. Scale bar: 100 μm for main images and 50 μm for detail images. (E) Application of scHCL analysis for nonimmune cells. Each row represents one cell type in scHCL. Each column represents a cell cluster in our dataset. Pearson’s correlation coefficient was used to evaluate cell-type gene expression similarity. Red indicates a high correlation; blue indicates a low correlation.
Figure 6
Figure 6
Diverse immune cell subtypes with hyperinflammatory response in periodontitis. (A) UMAP visualization of seven myeloid clusters in the combined health (n = 2; 148 cells) and periodontitis (n = 2; 539 cells) dataset. (B) Bubble heatmap showing marker genes across seven myeloid clusters from (A). Dot size indicates fraction of expressing cells, colored according to z-score-normalized expression levels. (C) Violin plots showing the expression of angiogenesis- and phagocytosis-related genes (see Methods for details) in three macrophage clusters. The gene expression levels are normalized and transformed as ln (CPM/10). (D) Violin plots showing the expression of classically activated macrophages (M1) and alternatively activated (M2) macrophage-related genes (see Methods for details) in three macrophage clusters. The gene expression levels are normalized and transformed as ln (CPM/10). (E) The relative percentage of CD11b+ cells in total cells and the proportion of C1QA+, NLRP3+, and PRDM1+ subpopulations in CD11b+ cells were analyzed by flow cytometry (healthy donors, n = 8 and patients n = 8; see Supplementary Figure S4B for gating strategy). (F) UMAP visualization of five T and NK cell subclusters in the combined health (n = 2; 276 cells) and periodontitis (n = 2; 2,599 cells) dataset. (G) Bar plots indicate the relative proportion of T-cell subsets in each sample (healthy = 2 and periodontitis = 2). (H) Heatmap showing the average expression of the top 5 differentially regulated genes for T and NK clusters identified in healthy gingival and periodontitis tissues. *P < 0.05 as determined by Student’s t-test.

References

    1. Tonetti MS, Van Dyke TE. Working Group 1 of the Joint EFPAAPw: Periodontitis and Atherosclerotic Cardiovascular Disease: Consensus Report of the Joint EFP/AAPWorkshop on Periodontitis and Systemic Diseases. J Periodontol (2013) 84 Suppl 4S:S24–9. 10.1902/jop.2013.1340019 - DOI - PubMed
    1. Genco RJ, Sanz M. Clinical and Public Health Implications of Periodontal and Systemic Diseases: An Overview. Periodontol 2000 (2020) 83(1):7–13. 10.1111/prd.12344 - DOI - PubMed
    1. Global Burden of Disease Study 2013 Collaborators . Global, Regional, and National Incidence, Prevalence, and Years Lived With Disability for 301 Acute and Chronic Diseases and Injuries in 188 Countries, 1990-2013: A Systematic Analysis for the Global Burden of Disease Study 2013. Lancet (2015) 386(9995):743–800. 10.1016/S0140-6736(15)60692-4 - DOI - PMC - PubMed
    1. Kinane DF, Stathopoulou PG, Papapanou PN. Periodontal Diseases. Nat Rev Dis Primers (2017) 3:17038. 10.1038/nrdp.2017.38 - DOI - PubMed
    1. Donos N. The Periodontal Pocket. Periodontol 2000 (2018) 76(1):7–15. 10.1111/prd.12203 - DOI - PubMed

Publication types