. 2021 Sep 6:9:e12141.
doi: 10.7717/peerj.12141. eCollection 2021.

Comprehensive analysis of abnormal expression, prognostic value and oncogenic role of the hub gene FN1 in pancreatic ductal adenocarcinoma via bioinformatic analysis and in vitro experiments

Affiliations

Comprehensive analysis of abnormal expression, prognostic value and oncogenic role of the hub gene FN1 in pancreatic ductal adenocarcinoma via bioinformatic analysis and in vitro experiments

Xiaohua Lei et al. PeerJ. .

Abstract

Background: Pancreatic ductal adenocarcinoma (PDAC) is one of the most commonly diagnosed cancers with a poor prognosis worldwide. Although the treatment of PDAC has made great progress in recent years, the therapeutic effects are still unsatisfactory. Methods. In this study, we identified differentially expressed genes (DEGs) between PDAC and normal pancreatic tissues based on four Gene Expression Omnibus (GEO) datasets (GSE15471, GSE16515, GSE28735 and GSE71729). A protein-protein interaction (PPI) network was established to evaluate the relationship between the DEGs and to screen hub genes. The expression levels of the hub genes were further validated through the Gene Expression Profiling Interactive Analysis (GEPIA), ONCOMINE and Human Protein Atlas (HPA) databases, as well as the validation GEO dataset GSE62452. Additionally, the prognostic values of the hub genes were evaluated by Kaplan-Meier plotter and the validation GEO dataset GSE62452. Finally, the mechanistic roles of the most remarkable hub genes in PDAC were examined through in vitro experiments.

Results: We identified the following nine hub genes by performing an integrated bioinformatics analysis: COL1A1, COL1A2, FN1, ITGA2, KRT19, LCN2, MMP9, MUC1 and VCAN. All of the hub genes were significantly upregulated in PDAC tissues compared with normal pancreatic tissues. Two hub genes (FN1 and ITGA2) were associated with poor overall survival (OS) rates in PDAC patients. Finally, in vitro experiments indicated that FN1 plays vital roles in PDAC cell proliferation, colony formation, apoptosis and the cell cycle.

Conclusions: In summary, we identified two hub genes that are associated with the expression and prognosis of PDAC. The oncogenic role of FN1 in PDAC was first illustrated by performing an integrated bioinformatic analysis and in vitro experiments. Our results provide a fundamental contribution for further research aimed finding novel therapeutic targets for overcoming PDAC.

Keywords: Bioinformatic analysis; FN1; I. vitro experiments; Pancreatic ductal adenocarcinoma.


Conflict of interest statement

The authors declare that they have no competing interests.

Figures

Figure 1
Figure 1. Identification of DEGs in PDAC microarray datasets and PPI network construction.
(A) Volcano plot of the DEGs in GSE15471, GSE16515, GSE28735 and GSE71729 datasets. (B) PPI network of the 233 intersected DEGs. (C) Heat map of the top 20 upregulated and downregulated DEGs. Upregulated genes were marked in red, downregulated genes were marked in blue. DEGs, differentially expressed genes; PDAC, pancreatic ductal adenocarcinoma; PPI, protein‑protein interaction.
Figure 2
Figure 2. DEGs analyzed by GO enrichment (A, B) and KEGG enrichment (C, D) according to downregulation (A, C) or upregulation (B, D) of genes.
DEGs, differentially expressed genes; GO, gene ontology. Y axis represents GO or KEGG pathway items; X axis represents the number of genes.
Figure 3
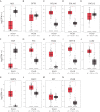
Figure 3. Validation of the mRNA expression levels of (A) ALB, (B) CFTR, (C) COL1A1, (D) COL1A2, (E) CXCL12, (F) EGF, (G) FN1, (H) ITGA2, (I) KRT19, (J) LCN2, (K) MMP9, (L) MUC1, (M) SST and (N) VCAN in pancreatic cancer tissues compared with normal pancreatic tissue.
*P < 0.05 was considered statistically significant. The expression level is described by log2(TPM+1). Red represents tumor (n = 179), brown represents nontumor (n = 171).
Figure 4
Figure 4. Validation of the mRNA expression levels of (A) ALB, (B) CFTR, (C) COL1A1, (D) COL1A2, (E) CXCL12, (F) EGF, (G) FN1, (H) ITGA2, (I) KRT19, (J) LCN2, (K) MMP9, (L) MUC1, (M) SST and (N) VCAN in pancreatic cancer tissues compared with normal pancreatic tissue.
The expression level is described by log2(TPM+1). Red represents tumor (n = 69), green represents nontumor (n = 61).
Figure 5
Figure 5. A meta-analysis of the mRNA expression levels of (A) ALB, (B) COL1A1, (C) COL1A2, (D) EGF, (E) FN1, (F) ITGA2, (G) KRT19, (H) LCN2, (I) MMP9, (J) MUC1 and (K) VCAN in PDAC tissues compared with normal pancreatic tissues by ONCOMINE.
The colored squares represent the median rank of these genes across five datasets in ONCOMINE. P-value < 0.05 was considered as statistically significant. PDAC, pancreatic ductal adenocarcinoma.
Figure 6
Figure 6. Validation of the protein expression levels of (A) COL1A1, (B) COL1A2, (C) FN1, (D) ITGA2, (E) KRT19, (F) LCN2, (G) MMP9, (H) MUC1 and (I) VCAN in PDAC tissues compared with normal pancreatic tissues by HPA database.
PDAC, pancreatic ductal adenocarcinoma; HPA, human protein atlas.
Figure 7
Figure 7. OS of the nine hub genes (COL1A1, COL1A2, FN1, ITGA2, KRT19, LCN2, MMP9, MUC1 and VCAN) in PDAC patients analyzed by (A) Kaplan–Meier plotter and the validation; (B) GEO dataset GSE62452.
Log-rank P < 0.05 was considered as statistically significant. OS, overall survival; PDAC, pancreatic ductal adenocarcinoma.
Figure 8
Figure 8. Depletion of FN1 inhibited cell proliferation, blocked cell cycle and induced apoptosis of PDAC cells.
(A) The knockdown efficiency of the siRNAs against FN1 was confirmed by qRT-PCR. (B–E) CCK-8, colony formation and EdU assays were performed to evaluate the proliferation of the PDAC cell lines. (F, G) Cell cycle was analyzed by flow cytometry and western blot. (H) Cell apoptosis marker Bax, clevaead-caspase9 and Bcl2 were analyzed by western blot. PDAC, pancreatic carcinoma; CCK-8, Cell Counting Cit-8; EdU, 5-Ethynyl-2′-deoxyuridine. Scale bar = 50 μm. *P < 0.05, **P < 0.01, ***P < 0.001.
Figure 9
Figure 9. GSEA (gene sets “KEGG_CELL_CYCLE” and “KEGG_APOPTOSIS”) results of discovery GEO datasets and the validation GEO dataset.
(A) GSEA results of GSE15471. (B) GSEA results of GSE16515. (C) GSEA results of GSE28375. (D) GSEA results of GSE71729. (E) GSEA results of GSE62452.

References

    1. Biankin AV, Waddell N, Kassahn KS, Gingras MC, Muthuswamy LB, Johns AL, Miller DK, Wilson PJ, Patch AM, Wu J, Chang DK, Cowley MJ, Gardiner BB, Song S, Harliwong I, Idrisoglu S, Nourse C, Nourbakhsh E, Manning S, Wani S, Gongora M, Pajic M, Scarlett CJ, Gill AJ, Pinho AV, Rooman I, Anderson M, Holmes O, Leonard C, Taylor D, Wood S, Xu Q, Nones K, Fink JL, Christ A, Bruxner T, Cloonan N, Kolle G, Newell F, Pinese M, Mead RS, Humphris JL, Kaplan W, Jones MD, Colvin EK, Nagrial AM, Humphrey ES, Chou A, Chin VT, Chantrill LA, Mawson A, Samra JS, Kench JG, Lovell JA, Daly RJ, Merrett ND, Toon C, Epari K, Nguyen NQ, Barbour A, Zeps N, Australian Pancreatic Cancer Genome I, Kakkar N, Zhao F, Wu YQ, Wang M, Muzny DM, Fisher WE, Brunicardi FC, Hodges SE, Reid JG, Drummond J, Chang K, Han Y, Lewis LR, Dinh H, Buhay CJ, Beck T, Timms L, Sam M, Begley K, Brown A, Pai D, Panchal A, Buchner N, De Borja R, Denroche RE, Yung CK, Serra S, Onetto N, Mukhopadhyay D, Tsao MS, Shaw PA, Petersen GM, Gallinger S, Hruban RH, Maitra A, Iacobuzio-Donahue CA, Schulick RD, Wolfgang CL, Morgan RA, Lawlor RT, Capelli P, Corbo V, Scardoni M, Tortora G, Tempero MA, Mann KM, Jenkins NA, Perez-Mancera PA, Adams DJ, Largaespada DA, Wessels LF, Rust AG, Stein LD, Tuveson DA, Copeland NG, Musgrove EA, Scarpa A, Eshleman JR, Hudson TJ, Sutherland RL, Wheeler DA, Pearson JV, McPherson JD, Gibbs RA, Grimmond SM. Pancreatic cancer genomes reveal aberrations in axon guidance pathway genes. Nature. 2012;491(7424):399–405. doi: 10.1038/nature11547. - DOI - PMC - PubMed
    1. Buddhan S, Sivakumar R, Dhandapani N, Ganesan B, Anandan R. Protective effect of dietary squalene supplementation on mitochondrial function in liver of aged rats. Prostaglandins, Leukotrienes and Essential Fatty Acids. 2007;76(6):349–355. doi: 10.1016/j.plefa.2007.05.001. - DOI - PubMed
    1. Chin CH, Chen SH, Wu HH, Ho CW, Ko MT, Lin CY. cytoHubba: identifying hub objects and sub-networks from complex interactome. BMC Systems Biology. 2014;8(Suppl 4):S11. doi: 10.1186/1752-0509-8-s4-s11. - DOI - PMC - PubMed
    1. Ding J, Liu Y, Lai Y. Identifying MMP14 and COL12A1 as a potential combination of prognostic biomarkers in pancreatic ductal adenocarcinoma using integrated bioinformatics analysis. PeerJ. 2020;8(3):e10419. doi: 10.7717/peerj.10419. - DOI - PMC - PubMed
    1. Fu J, Zhang X, Yan L, Shao Y, Liu X, Chu Y, Xu G, Xu X. Identification of the hub gene BUB1B in hepatocellular carcinoma via bioinformatic analysis and in vitro experiments. PeerJ. 2021;9(6447):e10943. doi: 10.7717/peerj.10943. - DOI - PMC - PubMed