Review
. 2021 Aug 20:22:101568.
doi: 10.1016/j.jcot.2021.101568. eCollection 2021 Nov.

Imaging update on soft tissue sarcoma

Affiliations
Review

Imaging update on soft tissue sarcoma

Aanand M Vibhakar et al. J Clin Orthop Trauma. .

Abstract

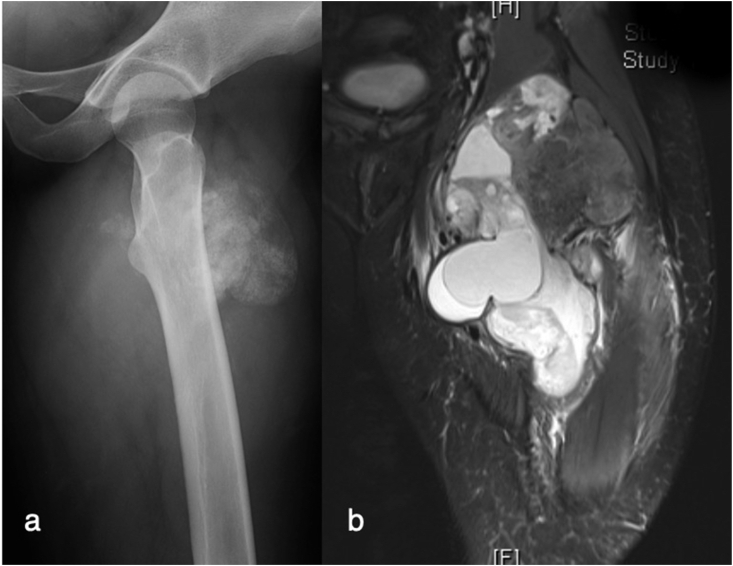
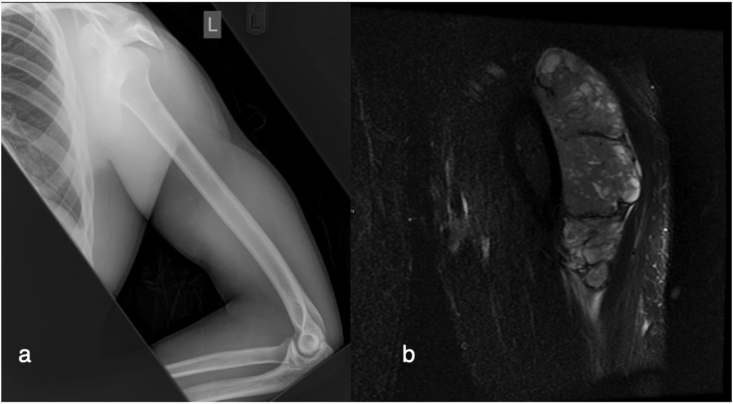
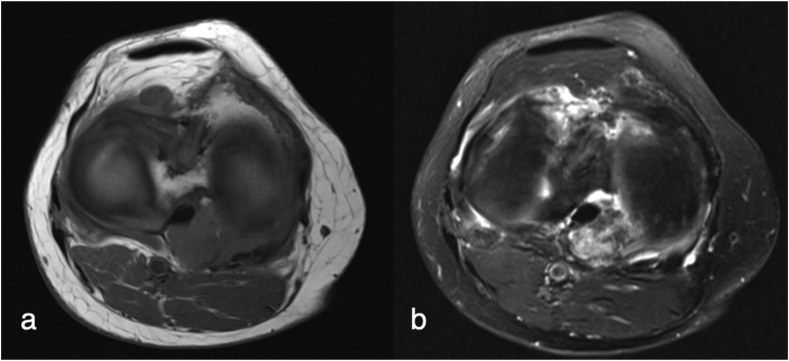
Soft tissue sarcomas (STS) are rare tumours presenting as soft tissue lumps. Ultrasound is often the primary modality for the initial assessment, with MRI the mainstay for lesion characterisation. PET/CT along with other emerging MRI sequences are used in certain situations as an adjunct and problem solving tool in STS staging and assessment of disease recurrence. Recent advances include the promise of whole body MRI, hybrid PET/MRI, diffusion weighted imaging, dynamic contrast enhanced MRI and advances in artificial intelligence. This article discusses current concepts in extremity STS imaging and highlights recent advances.

Keywords: Advances or current concepts or imaging concepts; CT, computed tomography; DCE-MRI, dynamic contrast enhanced magnetic resonance imaging; DWI, diffusion weighted imaging; FDG, fluorodeoxyglucose; Imaging or radiology or musculoskeletal radiology or MSK Radiology; MRI, magnetic resonance imaging; MSK, musculoskeletal; PET, positron emission tomography; STS, soft tissue sarcoma; Soft tissue sarcoma or soft tissue sarcomas or STS or STSs or sarcoma or sarcomas; Ultrasound or magnetic resonance imaging or MRI or PET-CT or CT or Computed tomography or X-Ray or contrast enhanced ultrasound or CEUS or Diffusion weighted imaging or DWI or Dynamic contrast enhancement or DCE-MRI or whole body MRI; WBMRI, whole body MRI.


Figures

Fig. 1
Fig. 1
Lipoma. AP radiograph of the left knee shows a well-defined ovoid lucency overlying the medial aspect of the distal femur that was subsequently shown to be a lipoma.
Fig. 2
Fig. 2
Synovial sarcoma. AP radiograph of the left proximal femur (a) demonstrates amorphous calcification partially overlying the left proximal femur without any evidence of periosteal reaction. A coronal fluid-sensitive fat-suppressed image (b) reveals a complex heterogenous mass which was subsequently proved to be a synovial sarcoma on biopsy.
Fig. 3
Fig. 3
Myositis ossificans. AP (a) and lateral (b) radiographs of the right knee demonstrate a well-defined irregular lesion within the soft tissues of the proximal posterior lower leg. More mature osteoid is seen peripherally with less mature osteoid centrally. The patient had a history of trauma to the region, concordant with the imaging findings suggestive of myositis ossificans.
Fig. 4
Fig. 4
Leiomyosarcoma. AP radiograph of the right knee (a) shows marked periosteal scalloping of the medial aspect of the proximal tibia by a slow-growing soft tissue lesion. Axial T1W image through the proximal right tibia (b) demonstrates a soft tissue mass with osseous erosion. Biopsy revealed a diagnosis of leiomyosarcoma.
Fig. 5
Fig. 5
Ewing sarcoma. A frontal radiograph of the left upper arm (a) shows no soft tissue abnormality. A coronal STIR image (b) demonstrates a heterogenous soft tissue mass arising from the brachialis muscle which was confirmed on biopsy as Ewing sarcoma.
Fig. 6
Fig. 6
Soft tissue sarcoma. A longitudinal ultrasound view of the right forearm reveals a subcutaneous well-defined, heterogenous lesion with marked internal vascularity that was proven to be a soft tissue sarcoma following biopsy.
Fig. 7
Fig. 7
Superficial lipoma. A longitudinal ultrasound view of the left upper thigh (a) revealed a fat-containing lesion in the subcutaneous tissues, which lies superficial to the deep fascia (broken yellow line). Further characterisation with T1W images (b) confirmed a superficial lipoma.
Fig. 8
Fig. 8
Deep lipoma. A transverse ultrasound view through the left anterior upper thigh (a) reveals a lipoma deep to the deep fascia (broken yellow line) and superficial to the rectus femoris and vastus lateralis muscles. A longitudinal ultrasound view (b) again demonstrates the lipoma just deep to the deep fascia (broken yellow line). An axial T1W image through the left upper thigh (c) confirms the lipoma.
Fig. 9
Fig. 9
Intramuscular lipoma. A longitudinal ultrasound view through the right upper arm (a) reveals an encapsulated intramuscular fat-containing lesion within the biceps brachii suggestive of an intramuscular lipoma. An axial T1W image (b) confirms a well-defined fat-containing intramuscular lesion diagnostic of a lipoma.
Fig. 10
Fig. 10
Myxoid lesion. A longitudinal ultrasound view through the left upper thigh (a) reveals a hypoechoic lesion with a few low-level internal echoes. Doppler ultrasound of the same lesion (b) demonstrates no vascularity. A longitudinal ultrasound view with an increased time gain compensation of the same lesion (c) revealed the solid nature of the previously thought cystic lesion which is now suggestive of a myxoid lesion. Coronal T1W (left) and STIR (right) images (d) demonstrate an intramuscular cystic lesion with surrounding inflammatory change in the adjacent muscles. A coronal T1W fat-saturated and contrast-enhanced image (e) demonstrates faint peripheral contrast enhancement, which was inconclusive. An aggressive process could not be excluded on ultrasound or MRI, and an ultrasound-guided biopsy (f) was performed. Histopathology supported a diagnosis of a benign intramuscular myxoma.
Fig. 11
Fig. 11
Lung metastases. Unenhanced CT demonstrates multiple bilateral lung metastases from a primary soft tissue sarcoma.
Fig. 12
Fig. 12
Tenosynovial giant cell tumour. Axial T1W image (a) revealed a soft tissue lesion in the posterior intercondylar notch of the knee. A corresponding T1W fat-saturated image (b) demonstrated contrast-enhancement within the lesion.
Fig. 13
Fig. 13
CT-guided biopsy of tenosynovial giant cell tumour. Due to the indeterminate imaging appearances of the enhancing soft tissue lesion in Fig. 12, a CT-guided biopsy was performed which avoided critical adjacent neurovascular structures such as the popliteal artery. Histopathology revealed a diagnosis of tenosynovial giant cell tumour.
Fig. 14
Fig. 14
The value of PET-CT in identifying target regions for biopsy. An axial CT image of the thorax performed for CT-guided biopsy of a suspected right chest wall soft tissue sarcoma (a) was non-diagnostic. Note the trough of the biopsy needle lies within the centre of the lesion. A subsequent PET-CT (b) demonstrated a non-viable central region of tumour where the biopsy sample had been acquired. The FDG-avid regions at the periphery of the lesion (bright areas) reveal the regions of viable tissue likely to yield a diagnostic sample.
Fig. 15
Fig. 15
Desmoid-type fibromatosis. A sagittal STIR image of the knee (a) reveals a multilobulated soft tissue lesion in the popliteal fossa with heterogenous signal and hypointense internal components suggestive of fibromatosis. A corresponding sagittal T1W image (b) demonstrates hypointensity with more hypointense internal components; further adding confidence to a diagnosis of fibromatosis. An axial T2W image (c) again demonstrates hypointensity with more hypointense internal components. Core biopsy confirmed desmoid-type fibromatosis.
Fig. 16
Fig. 16
Elastofibroma. An axial T1W image through the left chest wall (a) reveals an intermediate to low signal intensity subscapular mass deep to the serratus anterior muscle (yellow arrows), abutting the chest wall. An axial T2W image (b) also returns intermediate to low signal intensity (yellow arrows). An axial T1W fat-saturated post contrast image (c) demonstrates enhancement of the mass (yellow arrows), a common feature of elastofibromas.
Fig. 17
Fig. 17
Peripheral nerve sheath tumour. A longitudinal ultrasound view in the right ankle (a) demonstrates a heterogenous lesion with cranial and caudal ‘tails’ that exhibits marked central vascularity. The ‘tail’ represents contiguity with a peripheral nerve, in this case the sural nerve. This lesion was subsequently proven to be a malignant peripheral nerve sheath tumour on biopsy. A longitudinal ultrasound view of the right popliteal fossa in another case (b) again contains a heterogenous lesion with a ‘tail’ characteristic of a peripheral nerve sheath tumour. No internal vascularity was demonstrated. A sagittal proton density fat-suppressed of the right knee (c) demonstrates a well-defined, fusiform and hyperintense mass with a target sign (central low signal focus) contiguous with the muscular branches of the tibial nerve (yellow arrow) in keeping with a peripheral nerve sheath tumour. Subsequent histopathology revealed a benign morphology.
Fig. 18
Fig. 18
Myxoid liposarcoma. Coronal whole body MRI (a) with T1W (left) and fat-suppressed fluid sensitive (right) images demonstrate a well-defined myxoid lesion with solid and fluid components in the medial aspect of the left thigh. Axial diffusion weighted (DW) images with their corresponding apparent diffusion coefficient (ADC) maps (b) demonstrate some restricted diffusion of the lesion with a relative increased signal intensity in the DW image (top) and a corresponding lower signal in the ADC map (lower image). Histopathology revealed a diagnosis of myxoid liposarcoma.

References

    1. Cancer.org Key statistics for soft tissue sarcomas. 2021. https://www.cancer.org/cancer/soft-tissue-sarcoma/about/key-statistics.html [online] Available at:
    1. Gilbert N.F., Cannon C.P., Lin P.P., Lewis V.O. Soft-tissue sarcoma. J Am Acad Orthop Surg. 2009;17(1):40–47. doi: 10.5435/00124635-200901000-00006. - DOI - PubMed
    1. Miller B.J. Use of imaging prior to referral to a musculoskeletal oncologist. J Am Acad Orthop Surg. 2019;27(22) doi: 10.5435/JAAOS-D-19-00109. e1001-e1008. - DOI - PubMed
    1. Improving Outcomes for People with Sarcoma | Guidance. NICE; 2006. https://www.nice.org.uk/guidance/csg9 Nice.org.uk. Published.
    1. Belli P., Costantini M., Mirk P., Maresca G., Priolo F., Marano P. Role of color Doppler sonography in the assessment of musculoskeletal soft tissue masses [published correction appears in J Ultrasound Med 2001 May;20(5):516] J Ultrasound Med. 2000;19(12):823–830. doi: 10.7863/jum.2000.19.12.823. - DOI - PubMed

LinkOut - more resources