. 2021 Sep 23;3(3):lqab081.
doi: 10.1093/nargab/lqab081. eCollection 2021 Sep.

A combination of mRNA features influence the efficiency of leaderless mRNA translation initiation

Affiliations

A combination of mRNA features influence the efficiency of leaderless mRNA translation initiation

Mohammed-Husain M Bharmal et al. NAR Genom Bioinform. .

Abstract

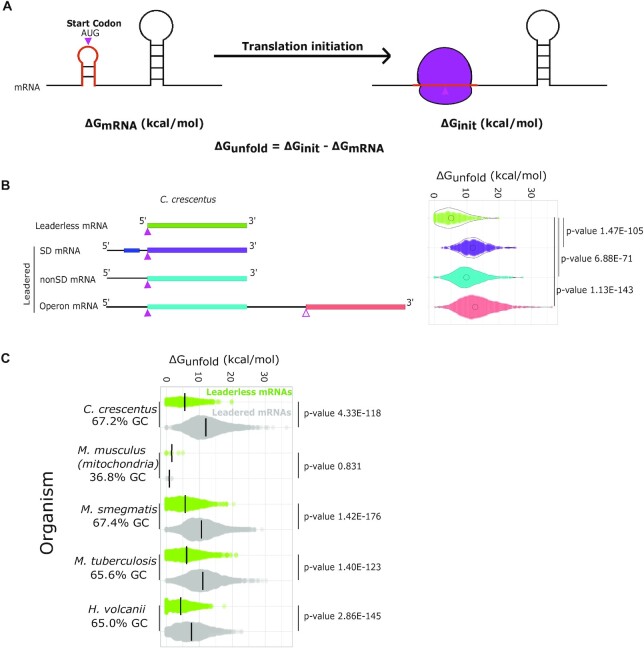
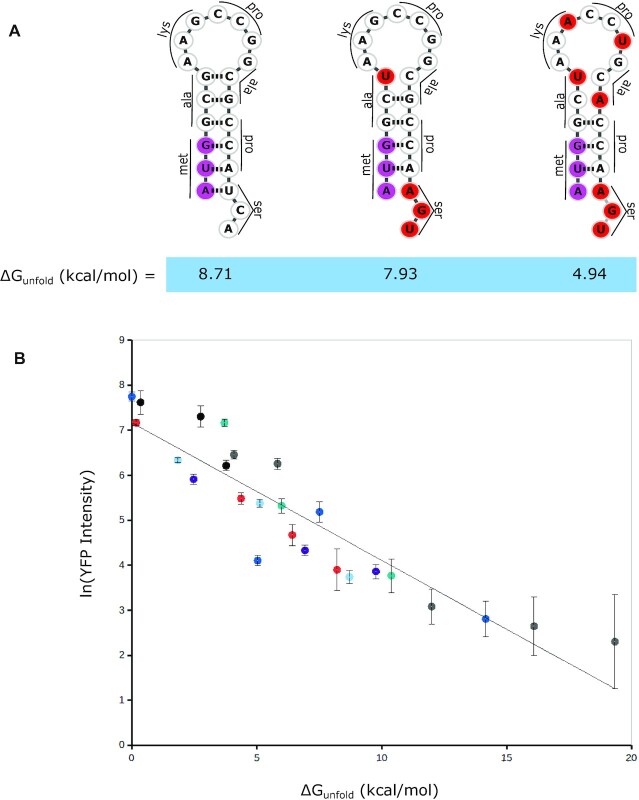
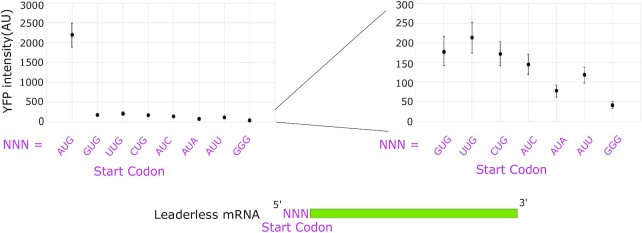
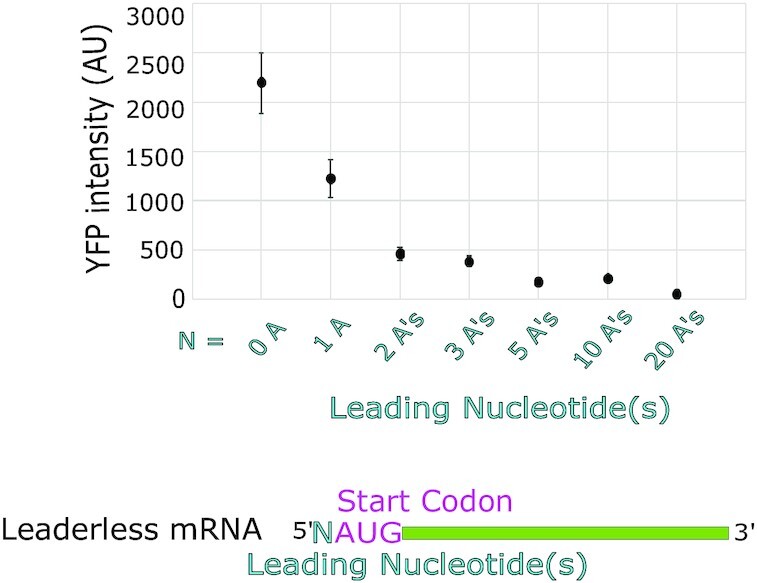
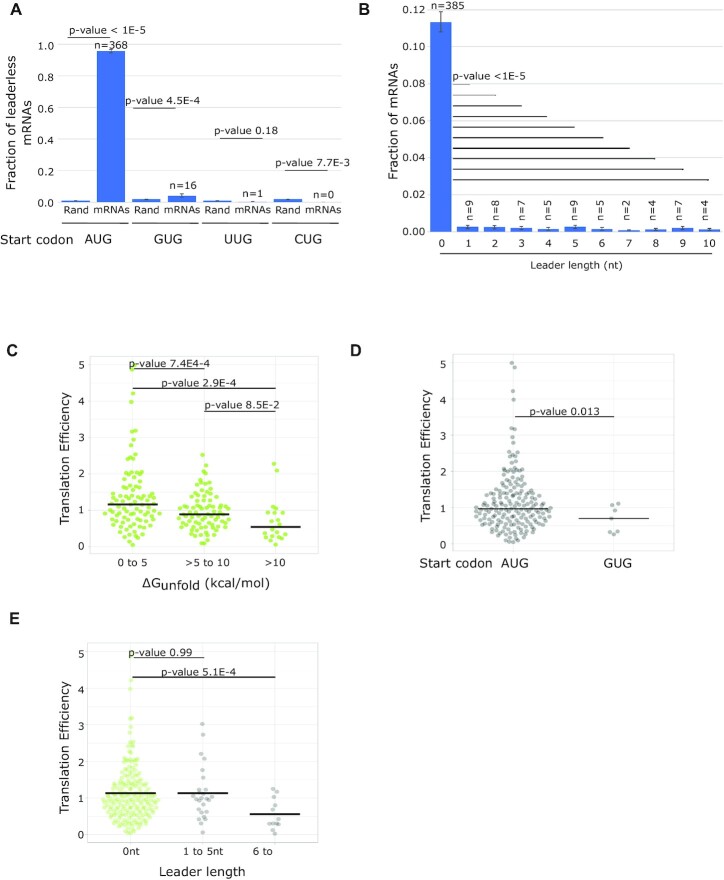
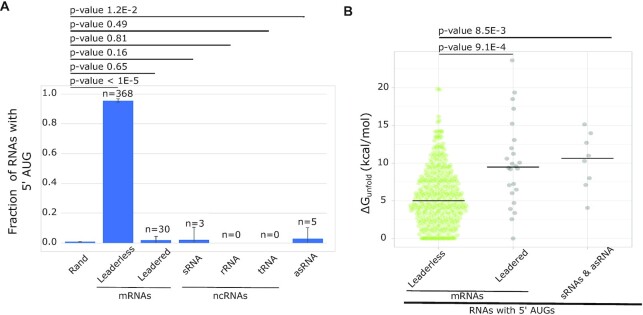
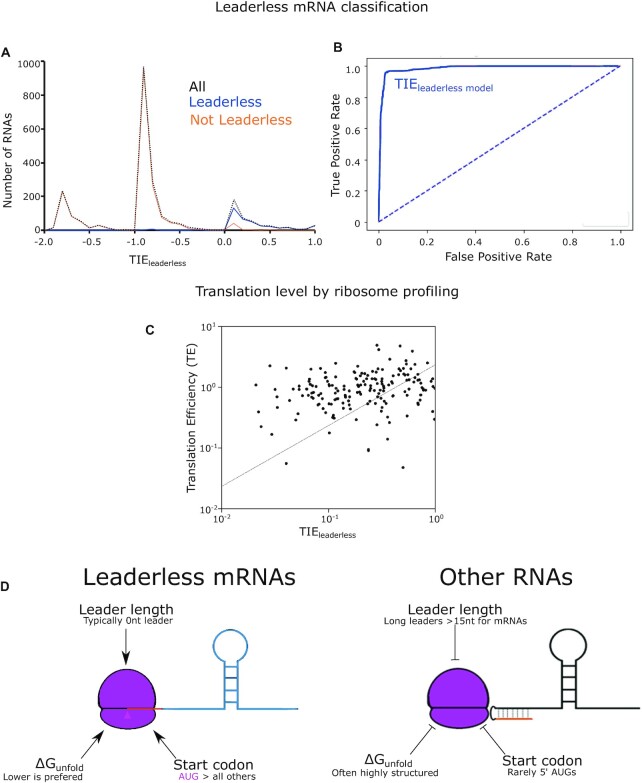
Bacterial translation is thought to initiate by base pairing of the 16S rRNA and the Shine-Dalgarno sequence in the mRNA's 5' untranslated region (UTR). However, transcriptomics has revealed that leaderless mRNAs, which completely lack any 5' UTR, are broadly distributed across bacteria and can initiate translation in the absence of the Shine-Dalgarno sequence. To investigate the mechanism of leaderless mRNA translation initiation, synthetic in vivo translation reporters were designed that systematically tested the effects of start codon accessibility, leader length, and start codon identity on leaderless mRNA translation initiation. Using these data, a simple computational model was built based on the combinatorial relationship of these mRNA features that can accurately classify leaderless mRNAs and predict the translation initiation efficiency of leaderless mRNAs. Thus, start codon accessibility, leader length, and start codon identity combine to define leaderless mRNA translation initiation in bacteria.


Figures

Figure 1.
Figure 1.
Leaderless mRNA TIRs are more accessible than leadered mRNAs. (A) Predicted unfolding energy of mRNAs. The predicted mRNA mfe (ΔGmRNA) is represented on the left. The orange TIR indicates a ribosome footprint surrounding the start codon (pink). The image on the right represents the mRNA upon initiation (ΔGinit) where the orange initiation region is unfolded. The ΔGunfold represents the amount of energy required by the ribosome to unfold the TIR of the mRNA. (B) Violin plots of ΔGunfold (right) calculated for all the mRNAs of each class (left) in the C. crescentus genome based on the transcript architecture (27,40). P-values were calculated based on a t-test (two-tailed, unequal variance). (C) Violin plots of ΔGunfold calculated for leaderless (green) and leadered (gray) mRNAs for various organisms with ribosome profiling data. ΔGunfold values were calculated using the optimal growth temperature of each microorganism and 37°C for M. musculus mitochondria. P-values were calculated based on a t-test (two-tailed, unequal variance).
Figure 2.
Figure 2.
ΔGunfold strongly influences leaderless mRNA translation. (A) A representative TIR synthetic stem loop synonymous mutation set with varying ΔGunfold values. The bases in the start codon are colored pink, and red bases highlight where mutations were introduced to disrupt base pairing. (B) In vivo translation reporter levels for the various leaderless RNA mutants. Each hairpin and its synonymous codon mutant set are shown with the same color (raw data can be found in Supplementary Table S1). Black points, leaderless set 1; gray points, leaderless set 2; dark blue points, leaderless set 3; purple points, leaderless set 4; light blue points, leaderless set 5; red points, leaderless set 6; and teal points, leaderless set 7. The natural log of the average YFP intensity per cell is shown and error bars represent the standard deviation of three biological replicates. The dotted blue line represents a linear curve fit with an R2 value of 0.84 and a slope of −0.3.
Figure 3.
Figure 3.
Leaderless mRNAs have a strong preference for AUG start codons. Leaderless mRNA in vivo translation reporters were generated with the start codons listed on the X-axis and their average YFP intensity per cell was measured. On the right is a zoomed-in view of all non-AUG codons tested. Error bars represent the standard deviation from three biological replicates.
Figure 4.
Figure 4.
Leaderless mRNAs are inhibited by additional upstream nucleotides. Leaderless mRNA in vivo translation reporters were generated with variable number of leading nucleotides on the X-axis and their average YFP intensity per cell was measured (raw data can be found in Supplementary Table S1). Error bars represent three biological replicates.
Figure 5.
Figure 5.
ΔGunfold, start codon identity and leader length correlate with TE across native leaderless mRNAs. (A) Bar graph showing the fraction of leaderless mRNAs starting with AUG, GUG, UUG and CUG start codons. Also shown are the random chances of trinucleotides being AUG, GUG, UUG and CUG calculated based on GC content (67%) of C. crescentus genome. P-values were calculated based on a two-tailed Z-test. (B) Bar graph showing the fraction of leaderless mRNAs and mRNAs with 5′ UTR of length 1–10 [as determined in (40)]. mRNAs containing SD sites were excluded from this analysis. P-values were calculated based on a two-tailed Z-test of each leader length compared to leader length 0. (C) Violin plot of TE as measured by ribosome profiling (54) of natural leaderless mRNAs binned in three groups depending on ΔGunfold values (0–5, 5–10 and >10 kcal/mol). P-values based on a t-test (two-tailed, unequal variances). (D) Violin plot of TE as measured by ribosome profiling (54) of natural leaderless mRNAs starting with AUG and GUG. P-values were calculated based on a t-test (two-tailed, unequal variance). (E) Violin plot showing the TE as measured by ribosome profiling (54) on the Y-axis of leaderless mRNAs (green) and with leaders of varying length (1–10) shown in gray. P-values were calculated based on a t-test (two-tailed, unequal variance).
Figure 6.
Figure 6.
Non-coding RNAs with 5′ AUGs are rare and have higher ΔGunfold. (A) Bar graph showing the fraction of natural leaderless mRNAs starting with trinucleotide AUG and other types of RNAs starting with trinucleotide AUG, but not initiated at that AUG (leadered mRNAs, sRNAs, rRNAs, tRNAs and asRNAs). Also shown is the random chance of trinucleotide being AUG out of 10 000 nucleotides, calculated based on GC content of C. crescentus genome. P-values were calculated using a two-tailed Z-test with each RNA class compared to the random probability of 5′ AUG. (B) Violin plot showing ΔGunfold of natural leaderless mRNAs starting with AUG (green) and other types of RNAs starting with AUG, but not initiated at that AUG (leadered mRNAs, RNAs and asRNAs) (shown in gray). P-values were calculated based on a t-test (two-tailed, unequal variance).
Figure 7.
Figure 7.
A combinatorial model accurately predicts translation of leaderless mRNAs. (A) Line graph showing the predicted TIEleaderless scores on the X-axis and the number of RNAs on the Y-axis. The solid blue line represents natural leaderless mRNAs. The orange line represents the RNAs that are not leaderless RNAs. The black dotted line represents all RNAs. RNAs with short leaders are shown in Supplementary Figure S2. (B) ROC curve (shown in solid blue, with ‘random’ shown as a dotted line) with true positive rate on the Y-axis and false positive rate on the X-axis. The AUC was calculated to be 0.99 for classification based on the TIEleaderless score and 0.68 for classification based solely on presence of a 5′ AUG (Supplementary Figure S3). (C) TE of leaderless mRNAs (Y-axis) is plotted compared to TIEleaderless (X-axis). The trendline is the result of a least-squares fit yielding a slope of 0.71 and R2 = 0.06. (D) Model design showing ribosome binding to the AUG trinucleotide (pink triangle) at the 5′ end when it is highly accessible as shown in the left. The ribosome binding is prevented when the region becomes more structured and the accessibility decreases.

References

    1. Drummond D.A., Wilke C.O.. The evolutionary consequences of erroneous protein synthesis. Nat. Rev. Genet. 2009; 10:715–724. - PMC - PubMed
    1. Kurland C.G., Ehrenberg M.. Growth-optimizing accuracy of gene expression. Annu. Rev. Biophys. Biophys. Chem. 1987; 16:291–317. - PubMed
    1. Rodnina M.V., Wintermeyer W.. Fidelity of aminoacyl-tRNA selection on the ribosome: kinetic and structural mechanisms. Annu. Rev. Biochem. 2001; 70:415–435. - PubMed
    1. Steitz J.A., Jakes K.. How ribosomes select initiator regions in mRNA: base pair formation between 3′ terminus of 16S rRNA and the mRNA during initiation of protein synthesis in Escherichia coli. Proc. Natl Acad. Sci. U.S.A. 1975; 72:4734–4738. - PMC - PubMed
    1. Chen H., Bjerknes M., Kumar R., Jay E.. Determination of the optimal aligned spacing between the Shine–Dalgarno sequence and the translation initiation codon of Escherichia coli mRNAs. Nucleic Acids Res. 1994; 22:4953–4957. - PMC - PubMed