. 2021 Sep;2(5):468-483.
doi: 10.1158/2643-3230.BCD-21-0047. Epub 2021 Apr 23.

Bortezomib induces anti-multiple myeloma immune response mediated by cGAS/STING pathway activation

Affiliations

Bortezomib induces anti-multiple myeloma immune response mediated by cGAS/STING pathway activation

Annamaria Gulla et al. Blood Cancer Discov. 2021 Sep.

Abstract

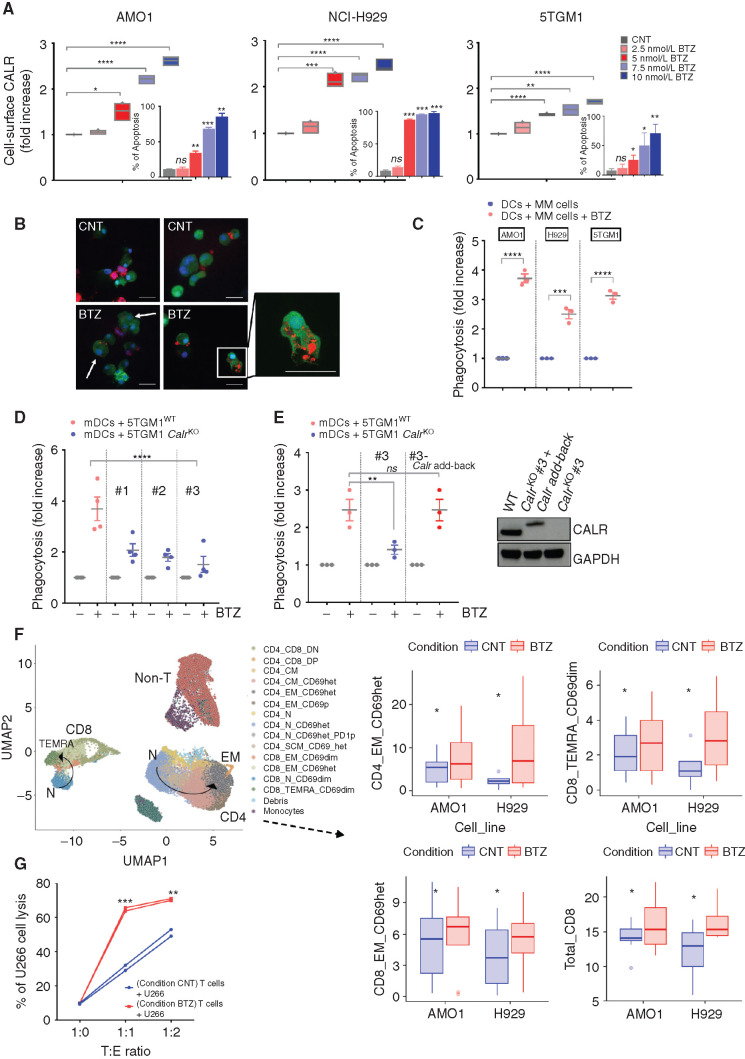
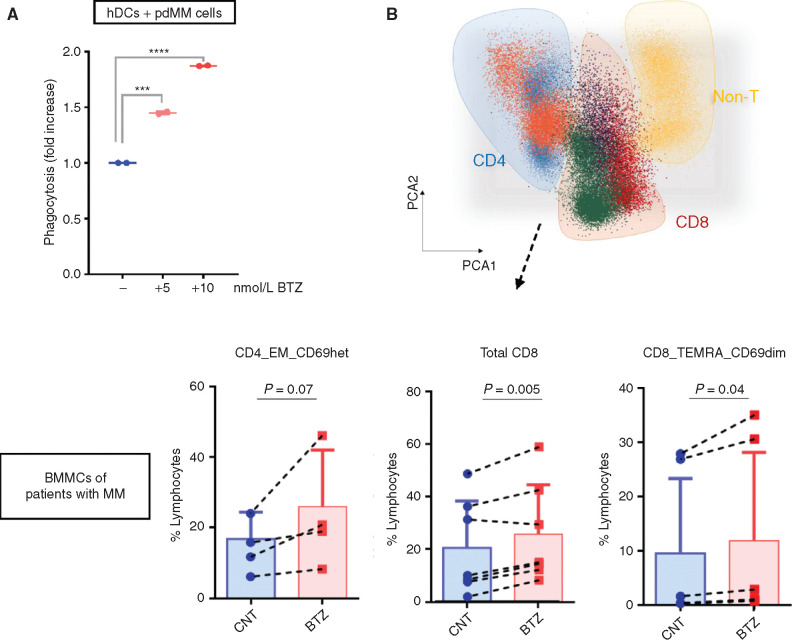
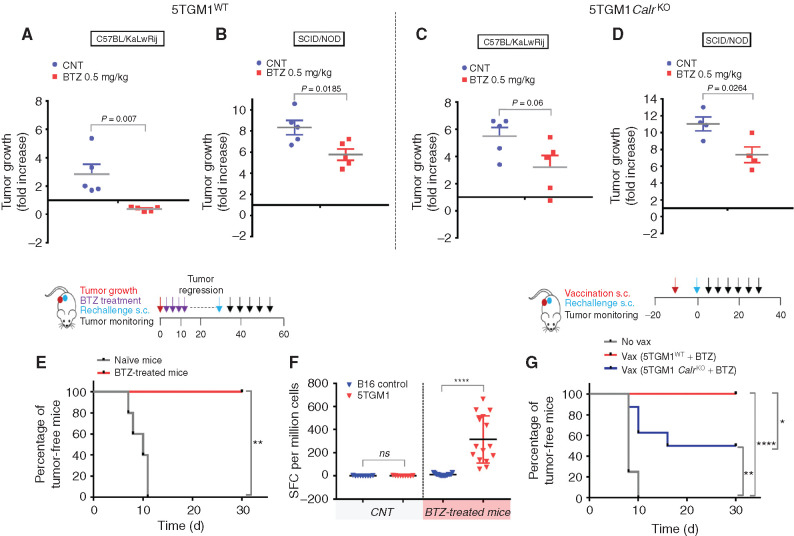
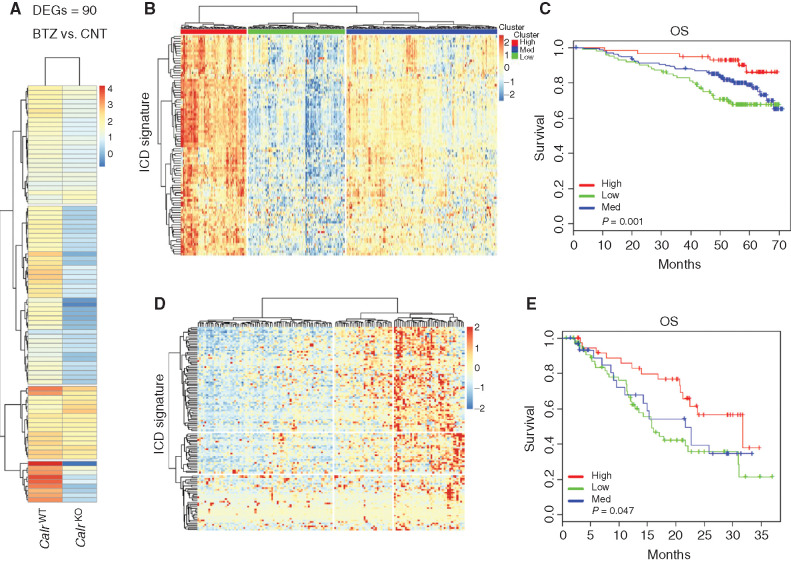
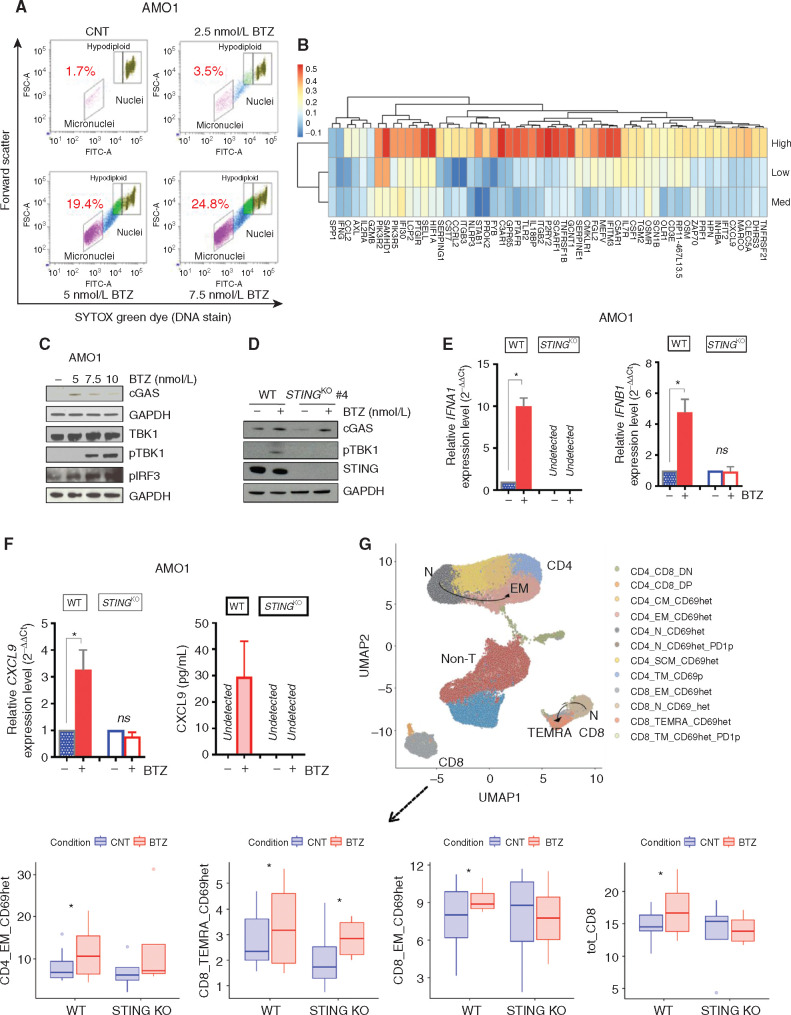
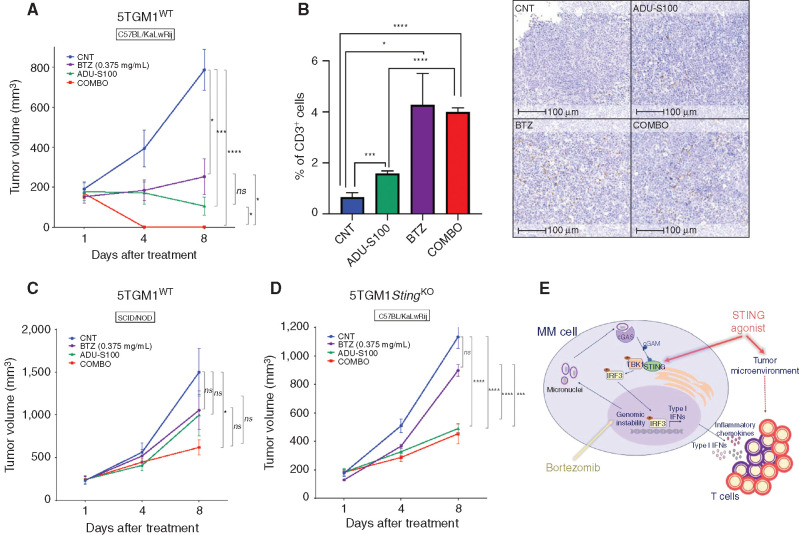
Proteasome inhibitor bortezomib induces apoptosis in multiple myeloma (MM) cells, and has transformed patient outcome. Using in vitro as well as in vivo immunodeficient and immunocompetent murine MM models, we here show that bortezomib also triggers immunogenic cell death (ICD) characterized by exposure of calreticulin on dying MM cells, phagocytosis of tumor cells by dendritic cells, and induction of MM specific immunity. We identify a bortezomib-triggered specific ICD-gene signature associated with better outcome in two independent MM patient cohorts. Importantly, bortezomib stimulates MM cells immunogenicity via activation of cGAS/STING pathway and production of type-I interferons; and STING agonists significantly potentiate bortezomib-induced ICD. Our studies therefore delineate mechanisms whereby bortezomib exerts immunotherapeutic activity, and provide the framework for clinical trials of STING agonists with bortezomib to induce potent tumor-specific immunity and improve patient outcome in MM.

Keywords: STING; bortezomib; immunogenic cell death (ICD); immunotherapy; multiple myeloma.


Conflict of interest statement

Conflict of interest KCA serves on advisory boards to Janssen, Pfizer, Astrazeneca, Amgen, Precision Biosciences, Mana, Starton, and Raqia, and is a Scientific Founder of OncoPep and C4 Therapeutics. NCM serves on advisory boards/consultant to Takeda, BMS, Celgene, Janssen, Amgen, AbbVie, Oncopep, Karyopharm, Adaptive Biotechnology, and Novartis and is a Scientific Founder of Oncopep. PGR serves on advisory boards for Celgene/BMS, Janssen, Jazz Pharmaceuticals, Karyopharm Therapeutics, Oncopeptides, Sanofi, Takeda and Secura Bio. The other authors have no other relevant conflict of interest.

Figures

Figure 1.
Figure 1.
BTZ induces ICD in multiple myeloma (MM) cells in vitro. A, Human AMO1, H929, and murine 5TGM1 multiple myeloma cell lines were treated with BTZ (1–10 nmol/L) or media (CNT) for 16 hours. CALR exposure was quantified by flow cytometry: Analysis of fluorescence intensity was assessed on viable (7-AAD–negative) cells. Floating bars show fold increase of the geometric mean normalized to CNT cells. Internal plots: percentage of apoptotic cells (Annexin-V positive) after BTZ treatment. Error bars are SD of three independent experiments for CALR analysis, and two experiments for apoptosis assays. P values were calculated by using two-tailed unpaired t test. B and C, For phagocytosis assays, Far Red–stained human AMO1, human H929, and murine 5TGM1 were left untreated or treated with BTZ for 16 hours. Then, they were cocultured with carboxyfluorescein diacetate succinimidyl ester (CFSE)–stained heterologous human DCs (hDC) or murine DCs (mDC), respectively. The JAWSII cell line was used as source of immature mDCs. Analysis was performed after 4 hours. In B are depicted representative confocal images showing interaction of mDCs (green) and 5TGM1 multiple myeloma cells (red), either untreated (CNT) or BTZ treated, after 4 hours of coculture. Scale bars, 20 μm. In C is shown the fold increase in percentage of double-positive DCs compared with CNT, as assessed by flow cytometry. Error bars are SEM of three independent experiments. Two-tailed unpaired t test. D, CFSE mDCs and 16-hour BTZ-treated or untreated Far Red-5TGM1WT or CalrKO (#1, #2, and #3) multiple myeloma cells were cocultured for 4 hours; fold increase in percentage of double-positive mDCs compared with CNT is shown. Error bars are SEM of four independent experiments. Unpaired t test to analyze the effect on each CalrKO clone compared with WT cells. E, Phagocytosis assay of BTZ-treated or untreated Far Red-5TGM1WT, CalrKO #3, or CalrKO #3 re-overexpressing Calr (#3 Calr add-back) cocultured with CFSE mDCs. Fold increase of percentage of double-positive mDCs compared with CNT is shown. Error bars are SEM of three independent experiments. Unpaired two-tailed t test. In the right plot, Western blot of CALR protein in 5TGM1WT, CalrKO #3, and CalrKO #3-Calr add-back is shown, with GAPDH as loading control. In the add-back clones, molecular weight of full-length Calr is larger than endogenous because its cDNA is in frame with the cDNA of the 5′ end of decay accelerating factor (DAF), which encodes a signal sequence for attachment of a glycophosphatidylinositol (GPI) anchor to the C-terminus of the resulting CALR–DAF fusion protein to facilitate CALR anchoring in the plasma membrane (44). F, Sixteen-hour BTZ-treated or untreated AMO1 and H929 cells were cocultured for 5 days with human DCs and T cells derived from the same healthy donors. CD4+ and CD8+ T cells were identified based on semiunsupervised bioinformatic analysis and are represented in a uniform manifold approximation and projection (UMAP) merging independent experiments for each cell line (left plot, arrows represent differentiation pattern). On the right plots, boxplots show absolute percentage of T-cell subsets that are significantly increased in the BTZ condition (according to ANOVA pairwise comparisons): CD4_EM_CD69het (P = 0.024), CD8_TEMRA_CD69dim (P = 0.029), CD8_EM_CD69het (P = 0.067), and total CD8 (P = 0.05). Data include eight independent experiments for the AMO1 cell line and four for the H929 cell line. Defining features of T-cell subset clusters are detailed in Supplementary Fig. S2A. G, Sixteen-hour BTZ-treated or untreated U266 cells were cocultured with HLA-matched hDCs and T cells from the same healthy donors. After 5 days, T cells were negatively selected from both coculture conditions (CNT and BTZ) and then cultured for 24 hours with new U266 cells prestained with CFSE at 1:0, 1:1, and 1:2 target:effector (T:E) ratio, followed by 7-AAD staining and quantification of multiple myeloma cell lysis by flow cytometry. Graph shows absolute percentage of dead multiple myeloma cells. ns, not significant; *, P < 0.05; **, P < 0.01; ***, P < 0.005; ****, P < 0.0001.
Figure 2.
Figure 2.
BTZ-mediated induction of immune response in patient-derived multiple myeloma (MM) cells in vitro. A, Flow cytometry–based phagocytosis assay: CFSE human DCs (hDC) from healthy donors were cocultured for 4 hours with BTZ-treated (5 and 10 nmol/L) or untreated Far Red pdMMs. Shown is the fold increase in percentage of double-positive DCs compared with CNT. Error bars are SEM of two independent experiments. ***, P < 0.001; ****, P < 0.0001 compared with CNT; two-tailed unpaired t test. B, Total autologous BMMCs from patients with multiple myeloma were cultured in the presence or absence of BTZ (5 nmol/L). After 5 days, flow cytometry analysis on CD4+ (n = 4) and CD8+ (n = 6) T cells was performed. Top plot, automatic population separator showing cells clustered based on their immunophenotypes. Bottom plots, boxplots show absolute percentage of T-cell subsets that are significantly increased in the BTZ condition (according to paired Student t test): CD4_EM_CD69het (P = 0.07), CD8_TEMRA_CD69dim (P = 0.04), and total CD8 (P = 0.005).
Figure 3.
Figure 3.
BTZ induces ICD in a syngeneic murine model of multiple myeloma (MM). AD, In vivo growth of subcutaneous xenografts of 5TGM1WT (A and B) or 5TGM1 CalrKO (C and D) multiple myeloma cells in immunocompetent C57BL/KaLwRij (A and C) or immunodeficient SCID/NOD (B and D) mice treated with either PBS (CNT) or BTZ (0.5 mg/kg twice/week for 2 weeks) when tumors became measurable by electronic caliper. Fold increase of tumor growth from day 1 (start of treatment) to day 8 ± SD (n = 5 animals per group in A, B, and C and n = 4 in D). One representative experiment of two yielding similar results is shown for each condition. P values were calculated using unpaired Student t test. E, Immunocompetent C57BL/KaLwRij (n = 5) bearing 5TGM1WT tumors were treated with BTZ as in A. Two weeks after tumor regression, BTZ-treated mice (n = 5) were rechallenged with viable 5TGM1 cells, along with naïve mice (n = 5), and percentage of mice remaining tumor free in the two cohorts is shown according to the Kaplan–Meier method. P value was calculated by using the log-rank test. Schema of the experimental design is shown in top plot. F, Ex vivo ELISPOT was performed on splenocytes harvested from mice treated as in E. Splenocytes were left unstimulated or stimulated with B16 tumor cells as negative control and 5TGM1 or anti-CD3 as positive control to test T-cell avidity in an IFNγ ELISPOT assay. Spot-forming colonies (SFC) per million are represented for n = 3 naïve and n = 5 BTZ-treated mice ± SD. ELISPOT experiments were performed in triplicate wells per sample; unpaired Student t test for statistical analysis. ELISPOT images are shown as Supplementary Fig. S4A. G, In vitro BTZ-treated 5TGM1WT or CalrKO cells were injected into naïve mice; control mice (No vax) received PBS as a negative control. Mice (n = 8 animals per group) were rechallenged with viable 5TGM1 cells 1 week later, and percentage of mice remaining tumor free in the three cohorts is shown according to the Kaplan–Meier method. The log-rank test was used for statistical significance. Schema of the experimental design is shown in top plot. ns, not significant; *, P < 0.05; **, P < 0.01; ****, P < 0.0001.
Figure 4.
Figure 4.
An ICD-related signature predicts clinical outcome in patients with multiple myeloma (MM) after BTZ treatment. A, Log2 fold-change (log2FC) values for 90 genes, as determined by RNA-seq analysis, in 5TGM1WT or 5TGM1 CalrKO tumors growing in immunocompetent C57BL/KaLwRij mice after two BTZ treatments (0.5 mg/kg). Columns represent the conditions, and rows are those differentially expressed genes (DEG) in the BTZ-treated cohort compared with the CNT cohort (n = 3 mice per group). FC > 1.5 and FDR < 0.05. B and D, Analysis of the human orthologs of this 90-gene murine ICD signature was performed in CD138+ multiple myeloma cells from two independent BTZ-treated cohorts of patients with multiple myeloma: IFM/DFCI 2009 dataset (n = 327; B) and GSE9782 (n = 152; D). Heatmaps identified three clusters of patients with multiple myeloma showing high (red), medium (blue), and low (green) expression of these signature genes. C and E, Kaplan–Meier plots show OS for the three patient clusters identified by expression of the 90 ICD gene signature. Red, blue, and green curves represent OS of patients with high, medium, and low ICD signature expression, respectively. Log-rank test P values for IFM/DCFI 2009 dataset and GSE9782 dataset are 0.01 and 0.047.
Figure 5.
Figure 5.
BTZ induces IFNI signaling and promotes T-cell activation via the cGAS/STING pathway. A, AMO1 cells were treated with BTZ (0 to 7.5 nmol/L) for 16 hours. Viable cells were separated using Ficoll gradient centrifugation. Dot plots show micronuclei quantification as a percentage of diploid nuclei, as detected by flow cytometry. In the analysis, remaining apoptotic cells were gated out using ethidium monoazide dye that crosses the compromised outer membrane of apoptotic and necrotic cells. One of two experiments yielding similar results is shown. B, Heatmap shows the correlation analysis of 57 ISGs included in the ICD signature with STING/TMEM173 gene expression across the three subsets of patients with multiple myeloma (IFM/DFCI 2009 dataset) expressing high, medium, and low levels of the ICD signature (as in Fig. 4). Blue and red identify lower and higher correlation scores, respectively. C, Western blot (WB) analysis of the STING pathway in AMO1 cells treated with increasing doses of BTZ (5–10 nmol/L) for 16 hours. GAPDH was used as loading control to quantify cGAS, TBK1, phosphor-TBK1 (pTBK1), and pIRF3 expression. D, WB analysis of cGAS, pTBK1, and STING in AMOWT and STINGKO cells treated with BTZ (5 nmol/L). E, qRT-PCR analysis of IFNA1 and IFNB1 mRNAs in AMOWT and STINGKO cells either untreated or after BTZ (5 nmol/L). Raw cross threshold (Ct) values were normalized to GAPDH housekeeping gene and expressed as ΔΔCt values. Data are the average of three independent experiments performed in triplicate. ns, not significant; *, P < 0.05; unpaired t test. F, Analysis of modulation of CXCL9 in AMOWT and STINGKO cells after treatment with BTZ (5 nmol/L) for 16 hours by qRT-PCR analysis of CXCL9 mRNA (left) and ELISA quantification of extracellular CXCL9 (right). Data are means of two independent experiments ± SEM. *, P < 0.1 (unpaired Student t test) compared with untreated cells. G, BTZ-treated or untreated AMOWT and STINGKO cells were cocultured with human DCs and T cells from the same healthy donors for 5 days. Cells were analyzed using a bioinformatic pipeline, and results reported in a uniform manifold approximation and projection (UMAP) including n = 8 independent experiments for the AMO1WT cell line and n = 4 for the AMO1 STINGKO cell line (top). Bottom plots show absolute percentage of T-cell subsets and increase in BTZ-treated compared with CNT in both cell lines: CD4_EM_CD69het (AMOWT: P = 0.027; STINGKO: P = ns), CD8_TEMRA_CD69het (AMOWT: P = 0.1; STINGKO: P = 0.09), CD8_EM_CD69het (AMOWT: P = 0.064; STINGKO: P = ns), and total CD8 (AMOWT: P = 0.09; STINGKO: P = ns); *, P < 0.1; ANOVA pairwise. Defining features of T-cell subset clusters are detailed in Supplementary Fig. S8H.
Figure 6.
Figure 6.
STING agonists potentiate BTZ-induced antitumor immunity. A, Tumor volume changes of subcutaneous 5TGM1WT xenografts in C57BL/KaLwRij mice treated with PBS (CNT), BTZ (0.375 mg/kg twice/week for 2 weeks), intratumoral administration of ADU-S100 (100 μg, days 1 and 2), or the combination of BTZ and ADU-S100. Average tumor growth ± SEM for each group (n = 5) is reported. P values were calculated using unpaired Student t test. B, Percentage of positive cells for CD3 staining. Graph depicts the mean ± SD of tumor xenograft sections 100 μm apart from representative CNT-, BTZ-, ADU-S100–, and COMBO-treated mice. Welch t test was used for statistical analysis. On the right, representative images of IHC CD3 staining on tumors retrieved from each group. Scale bars, 100 μm. C, Tumor volume changes of subcutaneous 5TGM1WT xenografts in SCID/NOD mice treated as in A. Average tumor growth ± SEM for each group (n = 6) is reported. Unpaired Student t test. D, Tumor volume analysis of subcutaneous 5TGM1 STINGKO xenografts in C57BL/KaLwRij mice treated as in A. Average tumor growth ± SEM for each group (n = 5) is reported. Unpaired Student t test. E, Schematic model. Combination of BTZ [which augments anti–multiple myeloma (MM) immune response by stimulating the STING pathway by increasing genomic instability] and STING agonist (which activates intratumor and tumor microenvironment STING downstream signaling) potentiates type I IFN response and increases T-cell recruitment and activation. ns, not significant; *, P < 0.05; ***, P < 0.005; ****, P < 0.001.

Comment in

References

    1. Gulla A, Anderson KC.Multiple myeloma: the (r)evolution of current therapy and a glance into future. Haematologica 2020;105:2358–67. - PMC - PubMed
    1. Kumar SK, Rajkumar V, Kyle RA, van Duin M, Sonneveld P, Mateos MV, et al. Multiple myeloma. Nat Rev Dis Primers 2017;3:17046. - PubMed
    1. Nakamura K, Smyth MJ, Martinet L.Cancer immunoediting and immune dysregulation in multiple myeloma. Blood 2020;136:2731–40. - PubMed
    1. Wudhikarn K, Wills B, Lesokhin AM.Monoclonal antibodies in multiple myeloma: current and emerging targets and mechanisms of action. Best Pract Res Clin Haematol 2020;33:101143. - PMC - PubMed
    1. Galluzzi L, Buque A, Kepp O, Zitvogel L, Kroemer G.Immunological effects of conventional chemotherapy and targeted anticancer agents. Cancer Cell 2015;28:690–714. - PubMed

Publication types