. 2021 Sep 27;11(10):jkab265.
doi: 10.1093/g3journal/jkab265.

Met is required for oligodendrocyte progenitor cell migration in Danio rerio

Affiliations

Met is required for oligodendrocyte progenitor cell migration in Danio rerio

Maria F Ali et al. G3 (Bethesda). .

Abstract

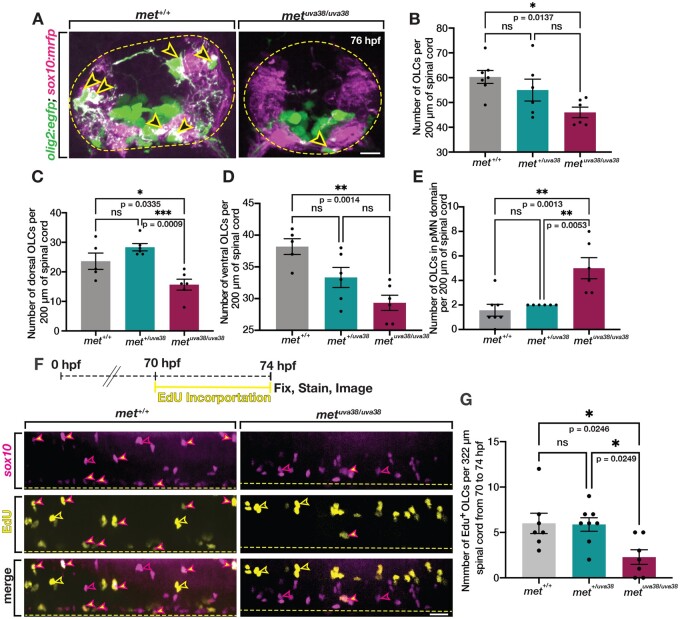
During vertebrate central nervous system development, most oligodendrocyte progenitor cells (OPCs) are specified in the ventral spinal cord and must migrate throughout the neural tube until they become evenly distributed, occupying non-overlapping domains. While this process of developmental OPC migration is well characterized, the nature of the molecular mediators that govern it remain largely unknown. Here, using zebrafish as a model, we demonstrate that Met signaling is required for initial developmental migration of OPCs, and, using cell-specific knock-down of Met signaling, show that Met acts cell-autonomously in OPCs. Taken together, these findings demonstrate in vivo, the role of Met signaling in OPC migration and provide new insight into how OPC migration is regulated during development.

Keywords: Met receptor; glial migration; oligodendrocyte progenitor cells; spinal cord development; zebrafish.


Figures

Figure 1
Figure 1
Kinase inhibitor screen identifies Met as mediator of dorsal OPC migration. (A) Schematic of kinase inhibitor screen and treatment paradigm that tested 430 kinase inhibitors for developmental OPC migration defects. Trichostatin A (TSA), which inhibits OPC specification, was used as a positive control. (B) Cartoon of a lateral view of 76 hpf olig2:egfp larvae spinal cord showing DMSO (negative control), TSA (positive control), and examples of possible hits: reduced OLCs in the dorsal spinal cord (SC) and increased OLCs in the dorsal SC. pMN denotes pMN domain. Yellow dashed lines mark the boundaries of the spinal cord and open yellow arrowheads mark dorsal OLCs. (C) Images taken from 18 h time-lapse movies of DMSO and MK2461-treated 55 hpf olig2:egfp zebrafish larvae. Yellow open arrowheads denote dorsally migrating OPCs. Yellow dashed line denotes ventral edge of the spinal cord. (D–F) Quantifications taken from time-lapse movies of DMSO (n = 7) and MK2461-treated (n = 7) larvae in (C). Mean with SEM. Student’s t-test was used in D–F. Scale bar, 20 μm.
Figure 2
Figure 2
Zebrafish OLCs express Met. (A) Transverse section of 3 dpf sox10:tagrfp;olig2:egfp zebrafish spinal cord labeled with an antibody for Met (magenta). Yellow open arrowheads denote sox10+/Met+ OLCs. White arrowheads denote sox10+/Met OLCs. Yellow dashed circle denotes boundary of the spinal cord. (B) Lateral view of metegfp zebrafish spinal cords at 48, 55, 72, and 96 hpf labeled with a Sox10 antibody. Asterisks denote examples of met+ motor neurons. Magenta-filled yellow arrowheads denote Sox10+/met+ OPCs, white arrowheads denote Sox10+/met OLCs. Yellow dashed line denotes ventral edge of the spinal cord. (C) Percentage of OLCs that are Sox10+ and met:gfp+ in 322 μm of spinal cord at 48 hpf (n = 18), 55 hpf (n = 12), 72 hpf (n = 14), and 96 hpf (n = 10). Mean with SEM. Statistical test: one-way ANOVA with Tukey’s Multiple Comparison Test. Scale bars, 10 μm (A), 20 μm (B).
Figure 3
Figure 3
Met receptor inhibition decreases the number of OLCs in spinal cord. (A) Dose–response curve of the number of OLCs in the dorsal spinal cord of fish treated from 24 hpf to 3 dpf with 1% DMSO (n = 8) and 10 μM MK2461 in 1% DMSO in the following doses: 2.5 μM (n = 8), 5 μM (n = 8), 7.5 μM (n = 7), 10 μM (n = 4), and 12.5 μM (n = 8). Statistical test: one-way ANOVA with Dunnett’s Multiple Comparison Test. (B) Transverse sections of 76 hpf olig2:egfp;sox10:tagrfp larvae treated with DMSO or 10 μM MK2461 from 24 hpf to 3 dpf. Yellow open arrowheads denote sox10+/olig2+ OLCs. (C–F) Quantification of olig2+/sox10+ OLCs from 10 sequential 20 μm sections of olig2:egfp;sox10:tagrfp larvae treated with DMSO (n = 9) or MK2461 (n = 8) from 24 hpf to 3 dpf. Mean with SEM. Student’s t-test was used in C–F. Scale bar, 10 μm.
Figure 4
Figure 4
Met is required for initiation of dorsal OPC migration. (A) Diagram of metuva38 mutant created using CRISPR/Cas9 mutagenesis with gRNA target sequence (yellow) and PAM site (blue) resulting in a 16 base pair insertion, which causes a frameshift mutation and early stop codon (asterisk). (B) Diagram of wildtype Met protein and Met mutant polypeptide sequences. (C) Images taken from 18 h time-lapse imaging of 55 hpf olig2:egfp met+/+, and metuva38/uva38 zebrafish larvae. Yellow open arrowheads denote dorsally migrating OPCs. Yellow dashed line denotes ventral edge of spinal cord. (D–F) Quantifications taken from time-lapse movies of 55 hpf olig2:egfp met+/+ (n = 8), met+/uva38 (n = 8), and metuva38/uva38 (n = 6) zebrafish larvae. Mean with SEM. Statistical test: one-way ANOVA with Tukey’s Multiple Comparison Test was used for D–F. Scale bar, 20 μm.
Figure 5
Figure 5
met mutants exhibit reduced OPC proliferation. (A) Transverse sections of 76 hpf olig2:egfp;sox10:mrfp met+/+ and metuva38/uva38 larvae. Open yellow arrowheads denote sox10+/olig2+ OPCs. Dashed yellow circle denotes boundary of the spinal cord. (B–E) Quantifications of olig2+/sox10+ OLCs from ten sequential 20 μm sections of 76 hpf olig2:egfp;sox10:mrfp met+/+ (n = 7), met+/uva38 (n = 6), and metuva38/uva38 (n = 6) larvae. Mean with SEM. Statistical test: one-way ANOVA with Tukey’s Multiple Comparison Test. (F) EdU treatment paradigm and lateral view spinal cord images of 74 hpf sox10:mrfp;met+/+ and metuva38/uva38 zebrafish larvae. Magenta-outlined yellow arrowheads denote sox10+/EdU+ OPCs. Magenta open arrowheads denote sox10+/EdU OLCs. Yellow open arrowheads denote sox10/EdU+ cells. Yellow dashed line denotes ventral edge of the spinal cord. (G) Quantifications of sox10+/EdU+ OLCs from spinal cord images of 76 hpf sox10:mrfp EdU labeled met+/+ (n = 7), met+/uva38 (n = 8), and metuva38/uva38 (n = 7) larvae. Mean with SEM. Statistical test: one-way ANOVA with Tukey’s Multiple Comparison Test. Scale bars (A) 10 μm, (F) 20 μm.
Figure 6
Figure 6
sox10:DNmet reduces OPC migration at 55 hpf. (A) Schematic of Met receptor showing site-specific mutations converting adenines (A) to thymines (T) resulting in amino acid changes of tyrosines (Y) to phenylalanines (F). (B) Diagram of amino acid substitutions in docking site tyrosines created using site-directed mutagenesis. (C) Diagram of developing neural tube showing sox10 turns on in pre-migratory OPCs around 36 hpf and olig1 turns on in migratory OPCs around 60 hpf. (D) Schematic of DNmet constructs showing DNmet is driven by either a sox10 or olig1 promoter and includes IRES:GFP coding sequence. (E) Lateral (upper) and optical section (lower) views of Sox10 antibody labeled 55 hpf wildtype, sox10:DNmet, and olig1:DNmet larvae. Horizontal yellow line denotes location of orthogonal view shown below. Blue open arrowheads denote ventral OPCs. Purple open arrowheads denote pMN domain OPCs. Yellow dashed line denotes ventral edge of the spinal cord. Yellow dashed circle denotes spinal cord boundary. (F–K) Quantifications taken from images of 55 hpf Sox10 antibody labeled wildtype (n = 10), sox10DN:met (n = 8), and olig1:DNmet (n = 12) zebrafish spinal cords. Mean with SEM. Statistical test: one-way ANOVA with Tukeys’s Multiple Comparison Test. Scale bar, 20 μm.
Figure 7
Figure 7
Met knock-down migration defects in pre-migratory OPCs persist to 72 hpf. (A) Lateral (upper) and optical section (lower) views of Sox10 antibody labeled 72 hpf wildtype, sox10:DNmet, and olig1:DNmet zebrafish larvae. Horizontal yellow line denotes location of orthogonal view shown below. Orange open arrowheads denote dorsal OLCs. Purple open arrowheads denote pMN domain OLCs. Blue open arrowheads denote ventral OLCs. Yellow dashed line denotes ventral edge of the spinal cord. Yellow dashed circle denotes spinal cord boundary. (B–G) Quantifications taken from images of 72 hpf Sox10 antibody labeled wildtype (n = 14), sox10DN:met (n = 13), and olig1:DNmet (n = 15) zebrafish spinal cords. Mean with SEM. Statistical test: one-way ANOVA with Tukey’s Multiple Comparison Test. Scale bar, 20 μm.

References

    1. Ashton RS, Conway A, Pangarkar C, Bergen J, Lim K, et al.2012. Astrocytes regulate adult hippocampal neurogenesis through ephrin-B signaling. Nat Neurosci. 15:1399–1406. doi:10.1038/nn.3212. - PMC - PubMed
    1. Auer F, Vagionitis S, Czopka T.. 2018. Evidence for myelin sheath remodeling in the CNS revealed by in vivo imaging. Curr Biol. 28:549–559.e3. doi:10.1016/j.cub.2018.01.017. - PubMed
    1. Bardelli A, Longati P, Williams TA, Benvenuti S, Comoglio PM.. 1999. A peptide representing the carboxyl-terminal tail of the Met receptor inhibits kinase activity and invasive growth. J Biol Chem. 274:29274–29281. doi:10.1074/jbc.274.41.29274. - PubMed
    1. Binari LA, Lewis GM, Kucenas S.. 2013. Perineurial glia require notch signaling during motor nerve development but not regeneration. J Neurosci. 33:4241–4252. doi:10.1523/JNEUROSCI.4893-12.2013. - PMC - PubMed
    1. Birchmeier C, Gherardi E.. 1998. Developmental roles of HGF/SF and its receptor, the c-Met tyrosine kinase. Trends Cell Biol. 8:404–410. doi:10.1016/S0962-8924(98)01359-2. - PubMed

Publication types

LinkOut - more resources