

A highly multiplexed quantitative phosphosite assay for biology and preclinical studies
- PMID: 34569154
- PMCID: PMC8474009
- DOI: 10.15252/msb.202010156
A highly multiplexed quantitative phosphosite assay for biology and preclinical studies
Abstract
Reliable methods to quantify dynamic signaling changes across diverse pathways are needed to better understand the effects of disease and drug treatment in cells and tissues but are presently lacking. Here, we present SigPath, a targeted mass spectrometry (MS) assay that measures 284 phosphosites in 200 phosphoproteins of biological interest. SigPath probes a broad swath of signaling biology with high throughput and quantitative precision. We applied the assay to investigate changes in phospho-signaling in drug-treated cancer cell lines, breast cancer preclinical models, and human medulloblastoma tumors. In addition to validating previous findings, SigPath detected and quantified a large number of differentially regulated phosphosites newly associated with disease models and human tumors at baseline or with drug perturbation. Our results highlight the potential of SigPath to monitor phosphoproteomic signaling events and to nominate mechanistic hypotheses regarding oncogenesis, response, and resistance to therapy.
Keywords: CPTAC; breast cancer; medulloblastoma; post-translational modifications; targeted mass spectrometry.
© 2021 The Authors. Published under the terms of the CC BY 4.0 license.
Conflict of interest statement
SAC is a member of the scientific advisory boards of Kymera, PTM BioLabs, and Seer and a scientific advisor to Pfizer and Biogen.
Figures
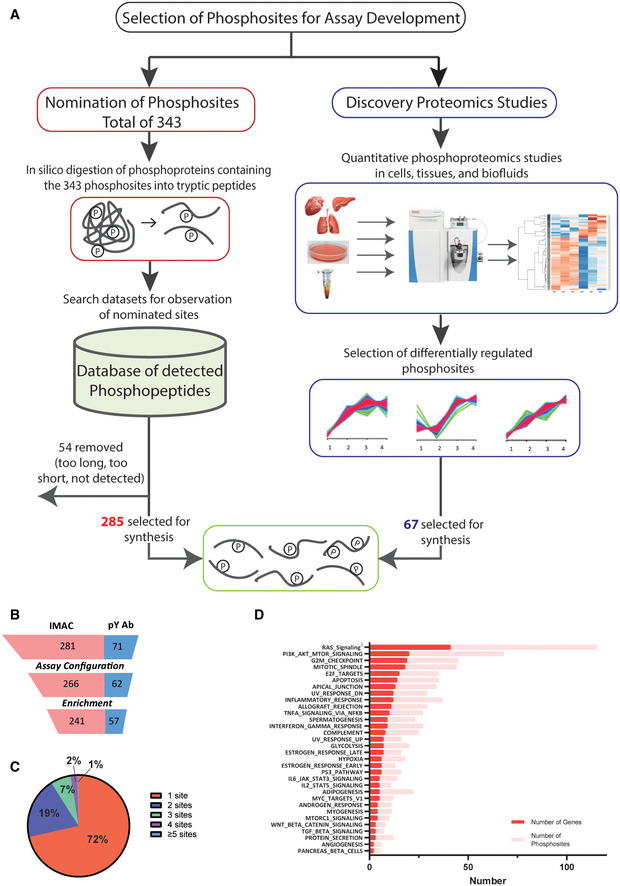
- A
Process for selecting phosphosites and phosphopeptides for SigPath assay development. Majority of phosphosites were nominated by experts, then converted into tryptic peptides, searched against existing datasets at the Broad for detection of them in MS data (see Materials and Methods section). One‐fourth of the phosphosites were included based on them being differentially regulated in quantitative phosphoproteomic studies (Mertins et al, 2014). Once finalized [C13, N15], stable isotope‐labeled versions of the peptides were synthesized for the assay.
- B
Assay configuration and testing statistics of SigPath. Twenty‐four out of 352 peptides failed the assay configuration due to their LC or MS characteristics, while another 30 failed during the pY Ab or IMAC enrichment step. Final SigPath assay targets 298 phosphopeptides with 284 phosphosites.
- C
Pie graph showing range of phosphosites per protein in the assay panel. 71% of the proteins are represented by only one phosphopeptide, 19% by two phosphopeptides. The remaining varies from 3 to 9 phosphopeptides.
- D
Pathways represented by SigPath in MSigDB Hallmark pathway category. To be included in the plot, a pathway had to have at least 5% coverage, or be represented by a minimum of three proteins and five phosphosites in the assay. Both, number of genes (red) and phosphosites (pink) are shown on the plot. 1Included from MSigDB WikiPathway pathway category.
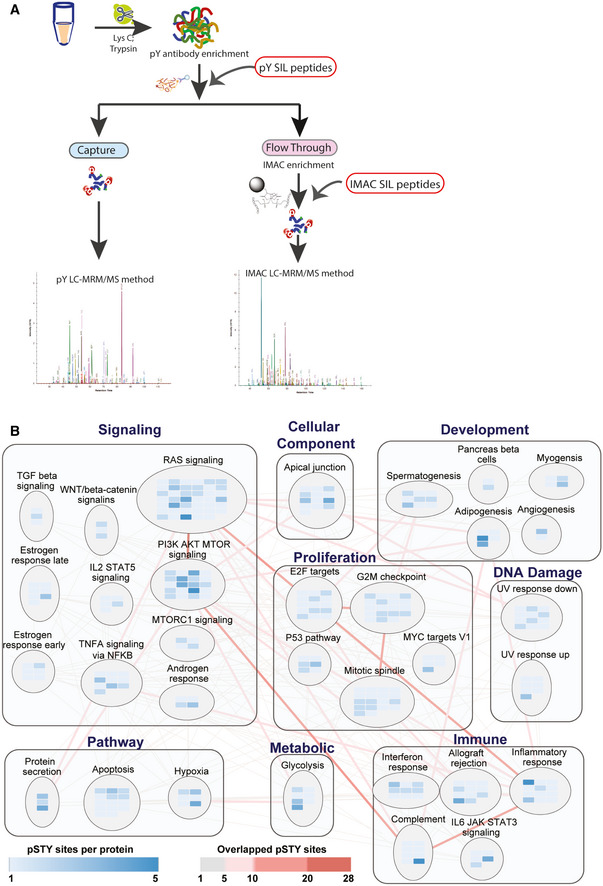
- A
In the full SigPath workflow, the heavy stable isotope‐labeled (SIL) pY peptide set is spiked into the digested sample and endogenous and spiked SIL peptides enriched using pY antibody. A portion of the flow‐through from the pY enrichment is then spiked with the IMAC set of SIL peptides and enriched by IMAC. Both, pY Ab and IMAC‐captured samples are analyzed on the MS using pY and IMAC LC‐MRM/MS methods, respectively (see Materials and Methods).
- B
MSigDB Hallmark gene sets and process categories (Liberzon et al, 2015) represented by SigPath. To be included in the plot, a pathway had to have at least 5% coverage, or be represented by a minimum of three proteins and five phosphosites in the assay. The RAS signaling pathway from WikiPathway (Martens et al, 2021) is also included in the plot. Each rectangle assembles gene sets in the same process category. Gene set is shown in circles in which blue colored rectangles refer to the proteins represented in the assay. Shades of blue indicate the number of phosphosites per protein in the assay. Edges show overlapping proteins and phosphosites between the different gene sets. Overlap of 1–5 phosphosites is indicated with gray lines, whereas overlap of more than 5 phosphosites is shown with red lines at increasing intensity. The larger the overlap, the more intense is the shade of red.
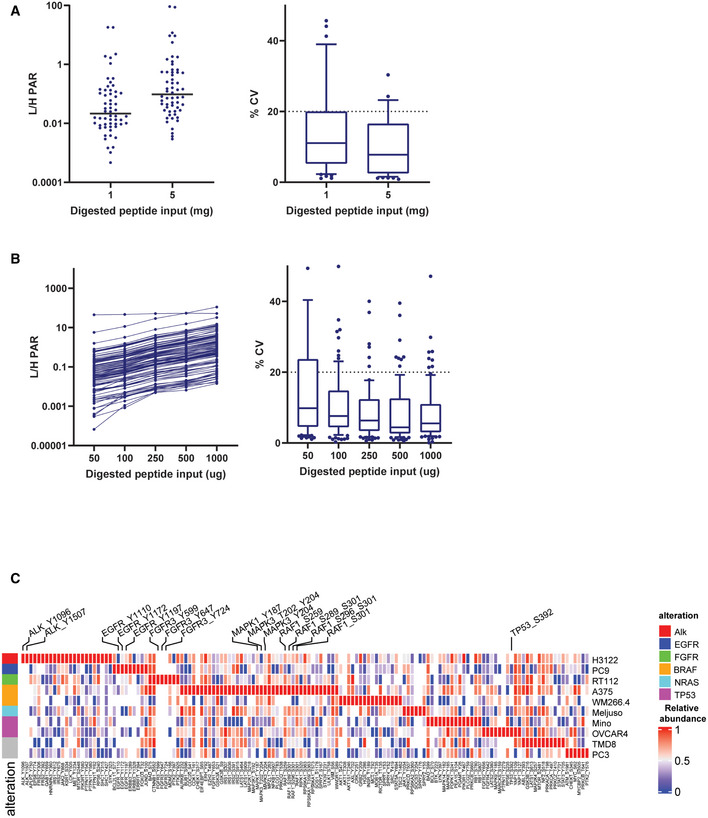
- A
Average light/heavy peak area ratio and %CV of the three replicates for all quantified peptides in titration curve experiment after pY Ab enrichment. Plot on the left shows the average values for all the quantified peptides along with a line representing the median value at 1 and 5 mg input protein level. The plot on the right shows the spread of %CVs at 1 and 5 mg input protein. The box represents interquartile range (IQR) with the lower, central, and the upper bands representing 25th percentile (Q1), median, and 75th percentile (Q3), respectively. The whiskers extend from 10 to 90 percentile of the data.
- B
Average light/heavy peak area ratio and %CV of the three replicates for all quantified peptides in titration curve experiment after IMAC enrichment. Plot on the left shows the average values for all the quantified peptides along with a line representing the median value at 0.05, 0.1, 0.25, 0.5, and 1 mg input protein level. The plot on the right shows the spread of %CVs at all the input protein levels. The box represents interquartile range (IQR) with the lower, central, and upper bands representing 25th percentile (Q1), median, and 75th percentile (Q3), respectively. The whiskers extend from 10 to 90 percentile of the data.
- C
Heat map showing relative abundances of all detected phosphosites across the 10 cell lines. Labeled are phosphosites on known driver genes in these cell lines. One replicate of each samples was processed and analyzed for this experiment. The heat map was generated using Morpheus online tool, the data are median‐MAD normalized, and colors are relative across rows, from row min to row max.
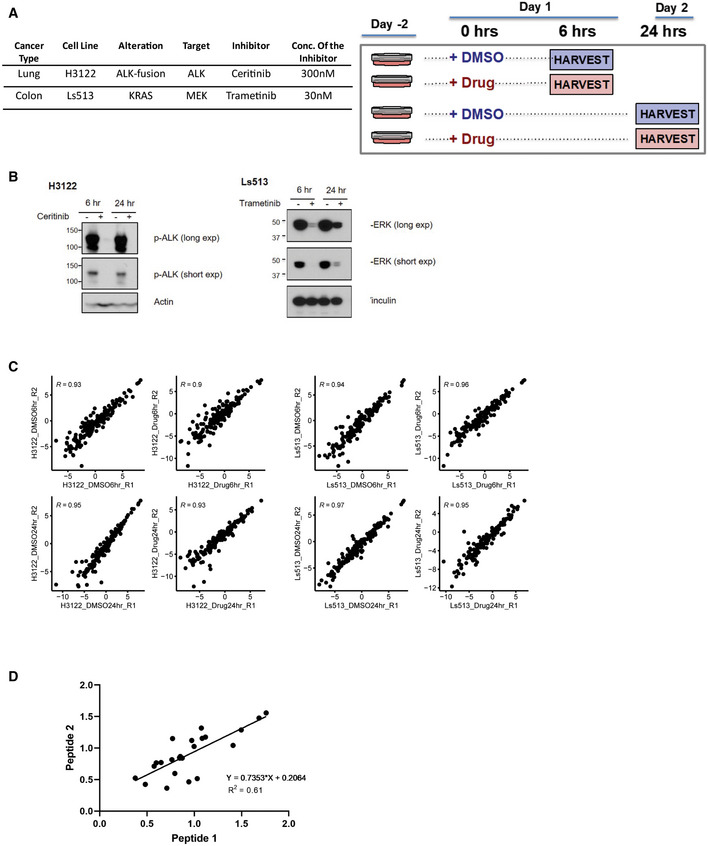
- A
Experimental design and details for drug treatment studies in H3122 and Ls513 cell lines. Table contains details about the cell lines as well as the inhibitor and concentration of it used. Cells were treated either with the inhibitor or DMSO for 6 and 24 h. Two process replicates were collected for each sample.
- B
Inhibition of pALK and pERK signaling in established human cell lines. Immunoblot analyses of cultured H3122 lung adenocarcinoma cells (on the left) treated with ALK inhibitor Ceritinib (+) or DMSO (−) for 6 and 24 h. Antibodies recognizing the phosphorylated 1507‐Tyrosine site of the ALK protein and the Actin protein (loading control) were used. Immunoblot analyses of cultured Ls513 colorectal carcinoma cells (on the right) treated with KRAS inhibitor Trametinib (+) or DMSO (−) for 6 and 24 h. Antibodies recognizing the phosphorylated Thr 185/Tyr 18 sites of the ERK1/ERK2 proteins and the vinculin protein (loading control) were used.
- C
Scatter plot of two process replicates of Log2 light/heavy PAR of each sample group. Shown on each plot is the Pearson correlation coefficient.
- D
Scatter plot of light/heavy peak area ratio of peptide 1 and peptide 2 measuring the same site for 12 of the sites measured in H3122 and Ls513 perturbagen experiments. X‐axis and y‐axis represent light/heavy peak area ratios. Shown on the graph is Pearson correlation coefficient.
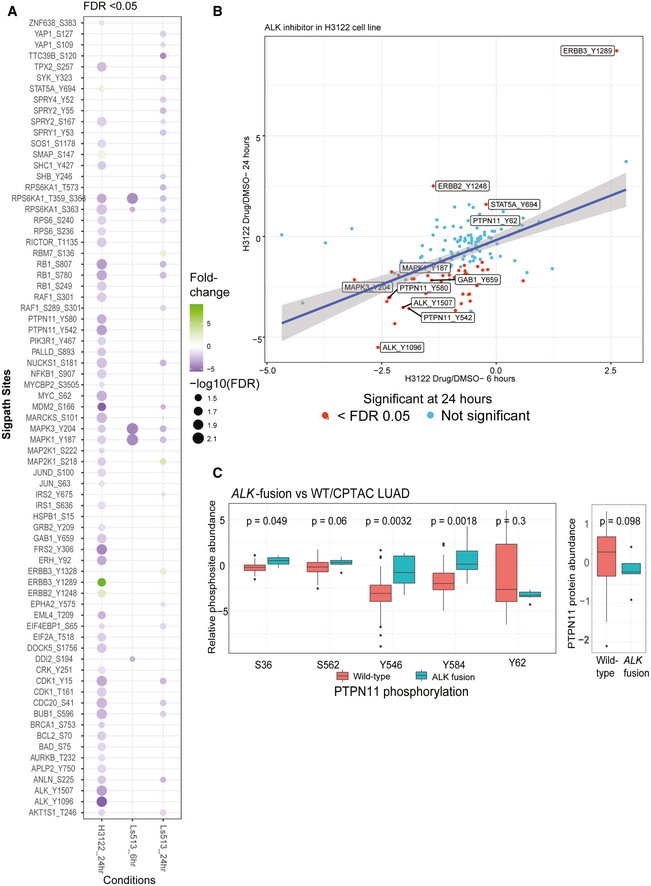
- A
Summary of all significantly regulated phosphosites observed in H3122 and Ls513 cell lines. The log2‐transformed light/heavy peak area ratios for two replicates per time point and treatment were used to compare drug treatment to DMSO. SigPath phosphopeptides differentially regulated upon treatment in each of the conditions in a moderated two‐sample t‐test (adj. P‐value < 0.05) are shown as circles. H3122 6‐h experiment did not yield any significant regulation and hence not shown on the figure. The color indicates fold change relative to DMSO, and the size of the circle indicates log10 (FDR).
- B
Scatter plot showing fold change of SigPath sites relative to DMSO for H3122 cell line treated with ALK inhibitor. X‐axis and Y‐axis show 6‐h and 24‐h time points, respectively. The red dots indicate sites with FDR < 0.05. Highlighted are a subset of key differentially regulated phosphosites.
- C
Box plot showing relative abundance of detected PTPN11 phosphosites and PTPN11 protein in the CPTAC LUAD tumors with and without ALK fusion (Gillette et al, 2020). The box represents interquartile range (IQR) with the lower, central, and the upper bands representing 25th percentile (Q1), median, and 75th percentile (Q3), respectively. The lower and upper whiskers represent Q1‐1.5*IQR, and the upper whisker shows Q3+1.5IQR. The data summarized represents patients wild type (n = 103) and mutant (n = 7). PTPN11 pY546 and pY584 sites showed the most significant upregulation (P‐value < 0.01, Wilcoxon test) in tumors with ALK‐fusion.
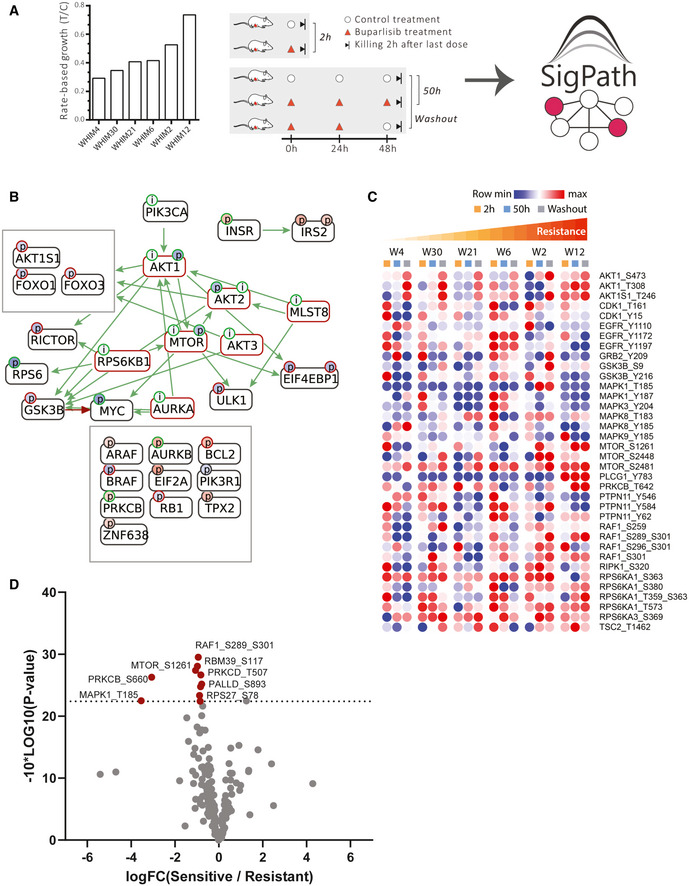
- A
Six patient‐derived xenograft models of triple‐negative breast cancer were assessed for their resistance to buparlisib, a PI3K inhibitor, and analyzed for their proteome and phosphoproteome (Mundt et al, 2018). The six models ranked after their resistance, from most sensitive to the left (WHIM4), to most resistant to the right (WHIM12). The resistance is calculated as rate‐based growth (treatment over control; T/C). Each PDX model was then treated with buparlisib or vehicle and tumors were collected at hours 2 or 50 (buparlisib/vehicle administered at hours 0, 24, and 48). Each of these six models subjected to five different treatments results in a total of 30 samples that were analyzed with the SigPath assay.
- B
CausalPath (
www.causalpath.org ) analysis of 2‐h drug/vehicle treatment data. Log2 (L/H PAR) for all 6 WHIM models was used for this analysis. Moderated one‐sample t‐test was used to analyze 2‐h treatment data. Resulting table was used for the CausalPath analysis. CausalPath network generated by comparing drug‐treated PDX samples to the controls at 2 h. Nodes represent proteins, and the (p) labels on the nodes represent significant differences in site‐specific phosphopeptide measurements. (p) Blue background color indicates a downregulated site, red background color indicates an upregulated site. Green border color around (p) indicates an activatory site, and a red border color indicates an inhibitory site. Green edges represent known site‐specific phosphorylations, and red edges represent dephosphorylations. The label (i) indicates an inhibited protein. In the case of PI3KCA, the label (i) indicates our manually inserted hypothesis of inactivated PIK3CA due to the drug effect. All other (i) labels on the graph are generated automatically by the CausalPath algorithm through statistical evaluation of the changes at the downstream of the protein. CausalPath infers the PI3KCA ‐> AKT1 relation, indicating the downregulated phosphorylation of AKT1 is likely due to inhibition of PIK3CA. Additionally, statistical measurements on the downstream of AKT proteins indicate their inactivation. We observe that this effect extends over downstream targets of AKT such as mTOR. - C
Heat map of 36 sites from Hallmark’s PI3K_AKT_mTOR pathway and mTOR, including MAPK3_Y204, detected in SigPath assay. Ratio of buparlisib treatment to vehicle for each time point is used. WHIMs are listed in the order of their resistance to buparlisib treatment. The row min, row max color scheme has been applied after the rows have been adjusted to robust Z‐scores (subtracted median and divided by the median absolute deviation; median‐MAD).
- D
Volcano plot comparing resistant versus sensitive models in 50‐h treatment samples. Sensitive (WHIMs 4, 30, 21, and 6) and resistant (WHIMs 2, and 12) are compared in a two‐sample moderated t‐test. Log2 fold changes are shown on the x‐axis, −10*log10 (P‐value) derived from the two‐sample moderated t‐test are shown on the y‐axis. Red dots indicate the 10 peptides significantly regulated with adj. P‐value threshold of < 0.1.
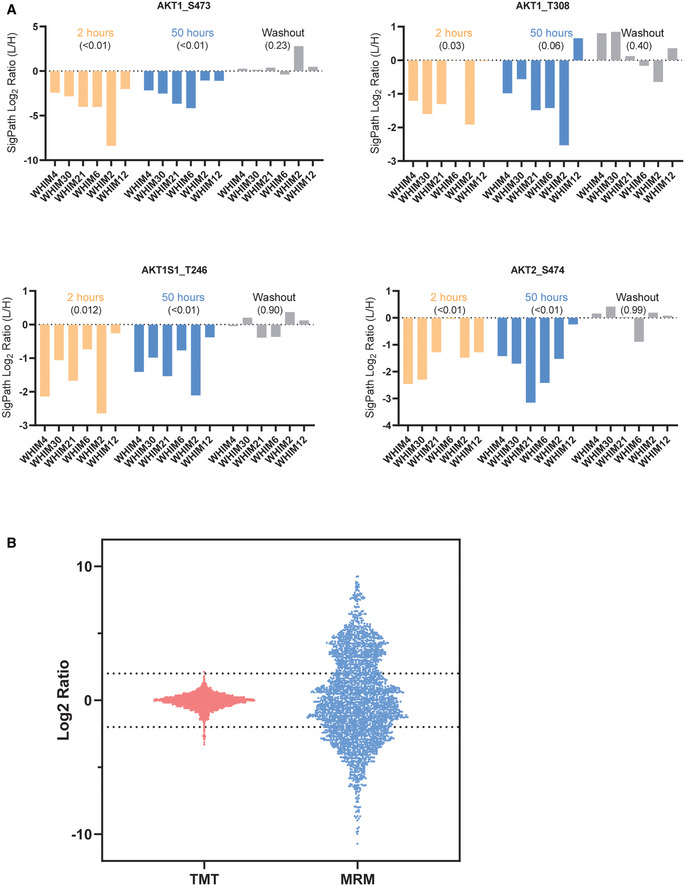
- A
Levels of AKT pS473, AKT pT308, AKT1S1 pT246, and AKT2 pS474 which are all pharmacodynamic markers for PI3K inhibition observed using SigPath. For each graph, and treatment in each graph, the WHIM/PDX models are sorted in the order of their resistance to the drug with least resistance on the left. Across all markers, the most resistant model (WHIM12) is the least affected at 50 h of buparlisib treatment. P‐values, in round brackets “()”, are calculated from a one‐sample t‐test, compared to a hypothetical mean of 0, using all WHIMS as replicates for a certain treatment.
- B
Bar and whisker plot showing the range of ratios obtained for the overlapped 115 peptides in discovery study using TMT and SigPath. For the discovery study, Log2 ratio of all the peptides to the pooled reference was used for the plot. For SigPath, Log2 ratio of light to heavy peptide was used for the plot.
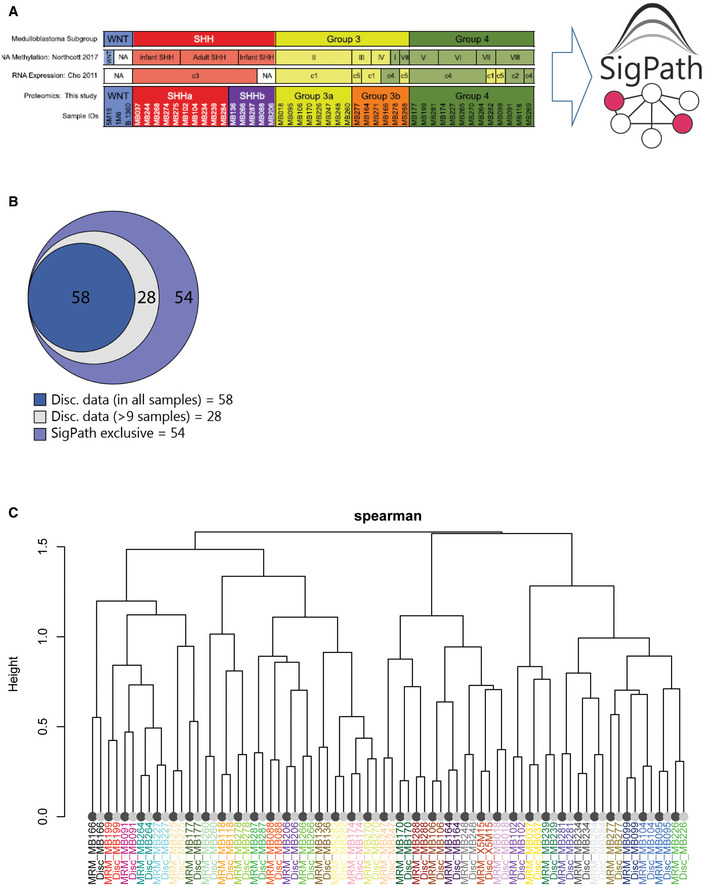
- A
List of samples used for this experiment and their classification to SHH, GR3, and GR4 as well as subgroups within SHH and GR3 (Archer et al, 2018). Only IMAC subset of the assay has been applied to these samples.
- B
Venn diagram showing the overlap of the 140 sites detected in SigPath assay with the discovery data. 86 peptides were detected in both datasets, 58 of these were detected in the discovery dataset in all samples (dark blue) while another 28 detected in at least 9 samples (light blue) of the discovery dataset. 54 sites (39%) were unique to SigPath assay (violet).
- C
Dendrogram illustrating the clustering of MRM (dark leaves) and discovery data (light leaves) of 86 phosphosites detected in both assays. Colors of sample identifiers are coordinated by patients. Log2 TMT ratio of each sample to the pooled reference was used for the discovery data after median‐MAD normalization. Log2 light/heavy ratios of SigPath data were used after normalizing each peptide by the median log2 light/heavy ratio across all samples. The dendrogram was derived from complete‐linkage hierarchical clustering using 1‐Spearman correlation as the distance metric. All sample pairs (MRM/discovery) cluster adjacent to each other.
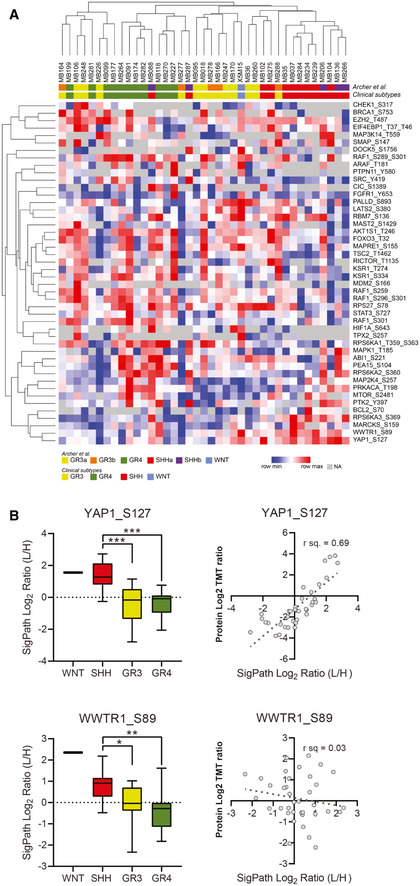
- A
A heat map of 39 samples with medulloblastoma showing 46 phosphosites uniquely detected in the SigPath assay. Samples are clustered by their original clinical subtypes as well as by new classification in ref. Archer et al (2018) where discovery analyses split subgroup 3 into 3b and 3a, and subgroup SHH into SHHa and SHHb. The heat map was generated using Morpheus online tool, the data are median‐MAD normalized, and colors are relative across rows, from row min to row max.
- B
Box plots comparing all the data for YAP1 pS127 and WWTR1 pS89 for all the samples in different groups of medulloblastoma (SHH, GR3, GR4, and WNT). One‐way ANOVA with an ad hoc Tukey’s test (with adj. P‐values for multiple comparisons) was applied for the comparison. The box represents interquartile range (IQR) with the lower, central, and upper bands representing 25th percentile (Q1), median, and 75th percentile (Q3), respectively. The whiskers extend from 5 to 95 percentile of the data. Scatter plots comparing TMT protein‐level Log2 ratios for YAP1 and WWTR1 to SigPath Log2 light to heavy ratios for YAP1 pS127 and TAZ pS89, respectively. Pearson correlation coefficient is shown on the plots.
References
-
- Abbatiello SE, Schilling B, Mani DR, Zimmerman LJ, Hall SC, MacLean B, Albertolle M, Allen S, Burgess M, Cusack MPet al (2015) Large‐scale interlaboratory study to develop, analytically validate and apply highly multiplexed, quantitative peptide assays to measure cancer‐relevant proteins in plasma. Mol Cell Proteomics 14: 2357–2374 - PMC - PubMed
-
- Abelin JG, Patel J, Lu X, Feeney CM, Fagbami L, Creech AL, Hu R, Lam D, Davison D, Pino Let al (2016) Reduced‐representation phosphosignatures measured by quantitative targeted MS capture cellular states and enable large‐scale comparison of drug‐induced phenotypes. Mol Cell Proteomics 15: 1622–1641 - PMC - PubMed
Publication types
MeSH terms
Substances
Grants and funding
LinkOut - more resources
Full Text Sources
Molecular Biology Databases
Miscellaneous
