. 2022 Jan 7;77(1):101-105.
doi: 10.1093/gerona/glab279.

Intrinsic Capacity Predicts Negative Health Outcomes in Older Adults

Affiliations

Intrinsic Capacity Predicts Negative Health Outcomes in Older Adults

Erwin Stolz et al. J Gerontol A Biol Sci Med Sci. .

Abstract

Background: Monitoring trajectories of intrinsic capacity (IC) in older adults has been suggested by the World Health Organization as a means to inform prevention to avoid or delay negative health outcomes. Due to a lack of longitudinal studies, it is currently unclear how IC changes over time and whether repeatedly measured IC predicts negative health outcomes.

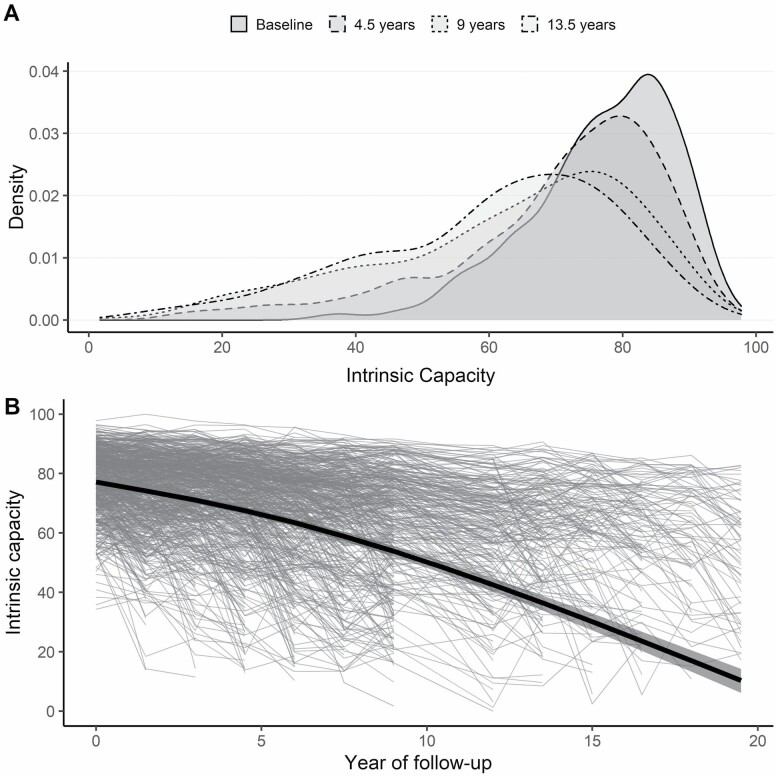
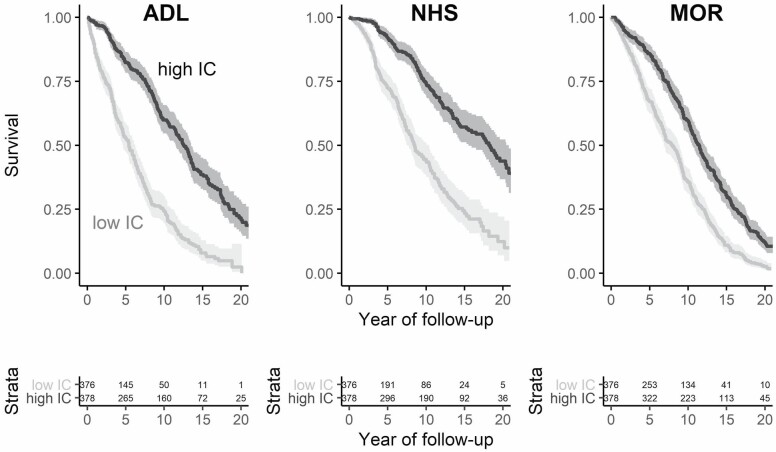
Methods: Based on 4 751 repeated observations of IC (range = 0-100) during 21 years of follow-up among 754 older adults 70 and older, we assessed longitudinal trajectories of IC, and whether time-varying IC predicted the risk of chronic activities of daily living disability, long-term nursing home stay, and mortality using joint models.

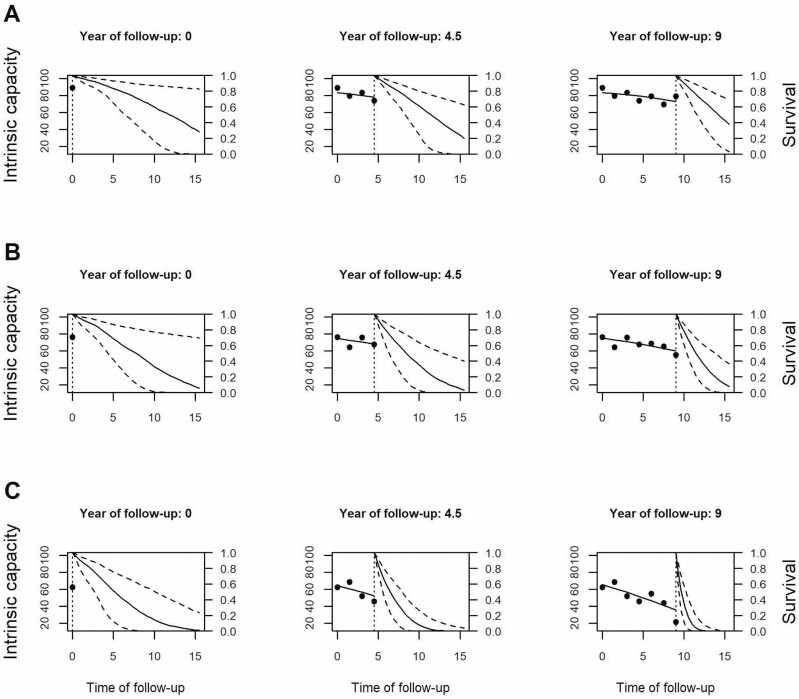
Results: Average IC declined progressively from 77 to 11 points during follow-up, with substantial heterogeneity between older adults. Adjusted for sociodemographics and chronic diseases, a 1-point lower IC value was associated with a 7% increase in the risk of activities of daily living disability, a 6% increase in the risk of a nursing home stay, and a 5% increase in mortality. Accuracy for 5- and 10-year predictions based on up to 3 repeated measurements of IC ranged between moderate and good (area under the receiver operating characteristic curve = 0.76-0.82).

Conclusions: Our study indicates that IC declines progressively and that it predicts negative health outcomes among older adults. Therefore, regular monitoring of IC could work as an early warning system informing preventive efforts.

Keywords: Epidemiology; Longitudinal; Normative aging; Successful aging.


Figures

Figure 1.
Figure 1.
Distribution and trajectory of intrinsic capacity (IC) over time. (A) Smoothed histograms of the distribution of values of IC at 4 selected points in time: baseline, 4.5, 9, and 13.5 years. (B) Thin gray lines show raw longitudinal observations of IC for 754 participants, which illustrate the broad variety of IC levels at baseline and of IC trajectories throughout follow-up (no measurement was available at 10.5 years of follow-up due to lack of funding). Thick black line shows the estimated average trajectory of IC from the mixed regression submodel. Shaded areas indicate 95% confidence intervals.
Figure 2.
Figure 2.
Baseline intrinsic capacity (IC) and negative health outcomes. Kaplan–Meier plots for survival probability (ie, the probability to not experience the respective health outcome) by IC category (high = above-median IC, low = below-median IC) at baseline. Shaded areas indicate 95% confidence intervals. Below, the absolute number of participants at risk by a group is shown. ADL = incidence of disability in activities of daily living; NHS = nursing home stay; MOR = mortality.
Figure 3.
Figure 3.
Dynamic predictions of ADL-free status for 3 selected participants. Trajectories of intrinsic capacity (IC) and associated ADL-free survival probabilities for 3 selected participants (A, B, and C) after 1, 4, and 7 repeated IC measurements based on joint model. The x-axis shows the time of follow-up in years, the y-axis on the left side represents IC, the y-axis on the right side indicates the estimated probability to remain ADL-free. Points are raw observations of IC, the dotted vertical line indicates the last IC measurement, solid lines left of the dotted vertical line represent IC trajectories (middle and right column), solid lines right of the dotted vertical line refer to trajectories of survival probability to remain ADL-free, and dashed lines show 95% prediction intervals.

References

    1. WHO. World Report on Ageing and Health. World Health Organization; 2015.
    1. Belloni G, Cesari M. Frailty and intrinsic capacity: two distinct but related constructs. Front Med (Lausanne). 2019;6:133. doi:10.3389/fmed.2019.00133 - DOI - PMC - PubMed
    1. Cesari M, Araujo de Carvalho I, Amuthavalli Thiyagarajan J, et al. . Evidence for the domains supporting the construct of intrinsic capacity. J Gerontol A Biol Sci Med Sci. 2018;73(12):1653–1660. doi:10.1093/gerona/gly011 - DOI - PubMed
    1. Gill TM, Williams CS, Richardson ED, Tinetti ME. Impairments in physical performance and cognitive status as predisposing factors for functional dependence among nondisabled older persons. J Gerontol A Biol Sci Med Sci. 1996;51(6):M283–M288. doi:10.1093/gerona/51a.6.m283 - DOI - PubMed
    1. Studenski S, Perera S, Patel K, et al. . Gait speed and survival in older adults. JAMA. 2011;305(1):50–58. doi:10.1001/jama.2010.1923 - DOI - PMC - PubMed

Publication types