. 2022 Mar 1;135(5):jcs259365.
doi: 10.1242/jcs.259365. Epub 2021 Oct 22.

A palmitoylation code controls PI4KIIIα complex formation and PI(4,5)P2 homeostasis at the plasma membrane

Affiliations

A palmitoylation code controls PI4KIIIα complex formation and PI(4,5)P2 homeostasis at the plasma membrane

Alex G Batrouni et al. J Cell Sci. .

Abstract

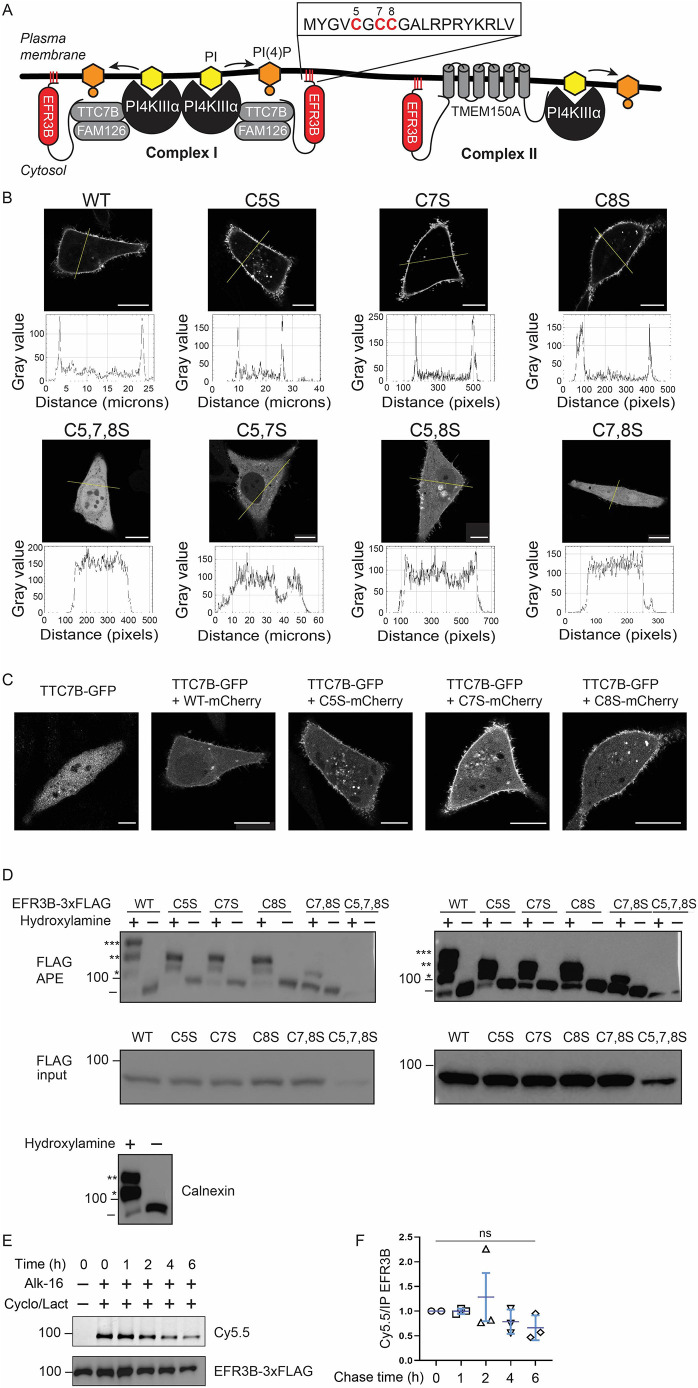
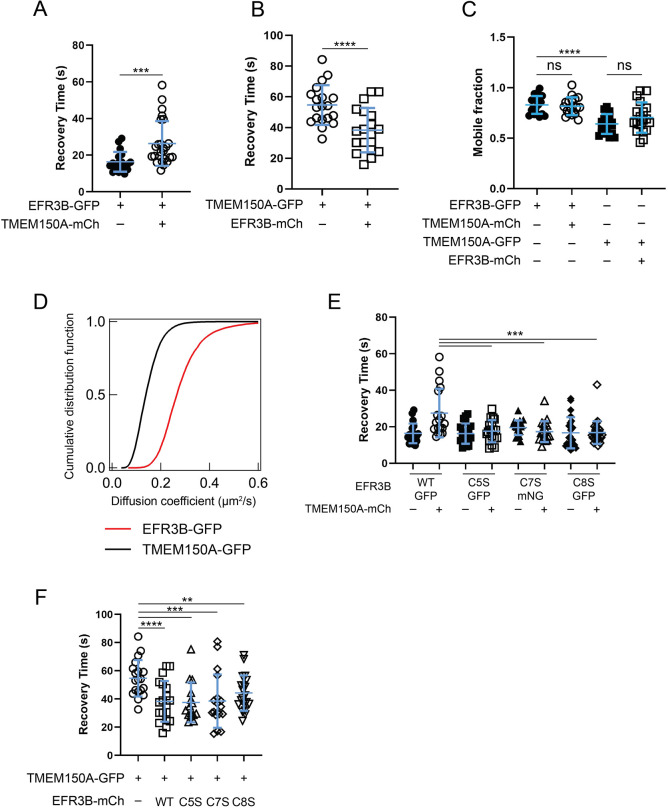
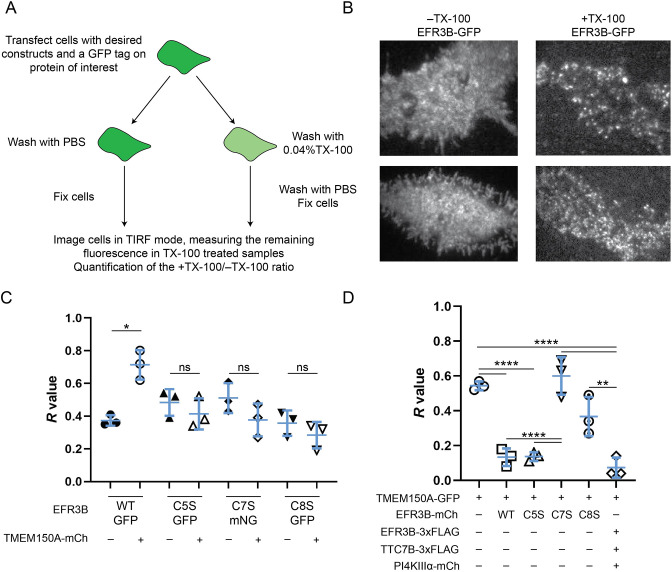
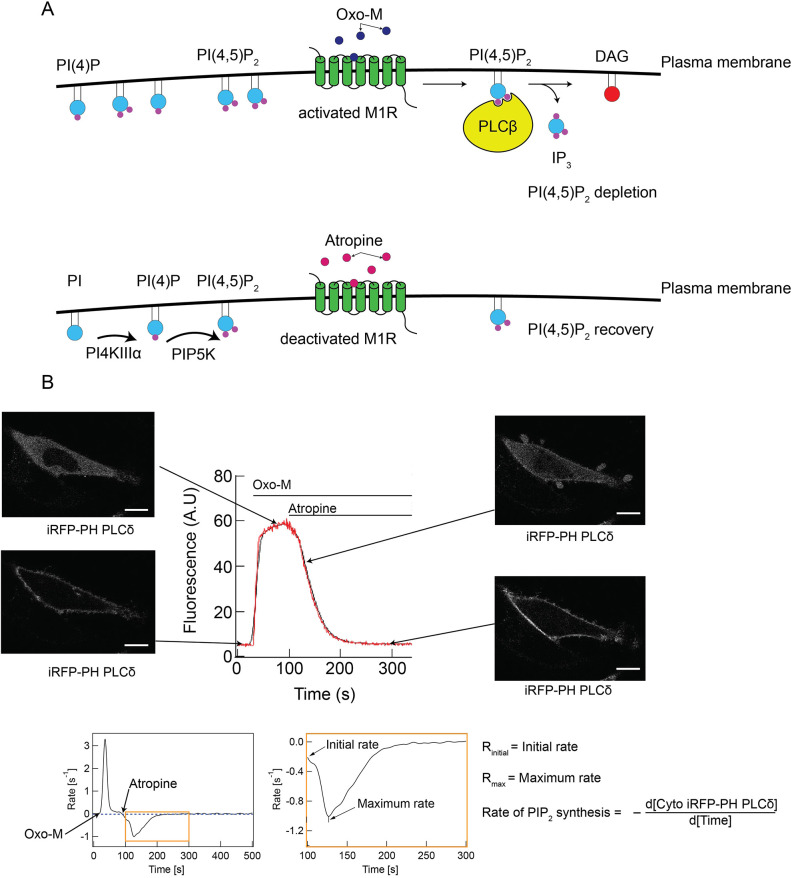
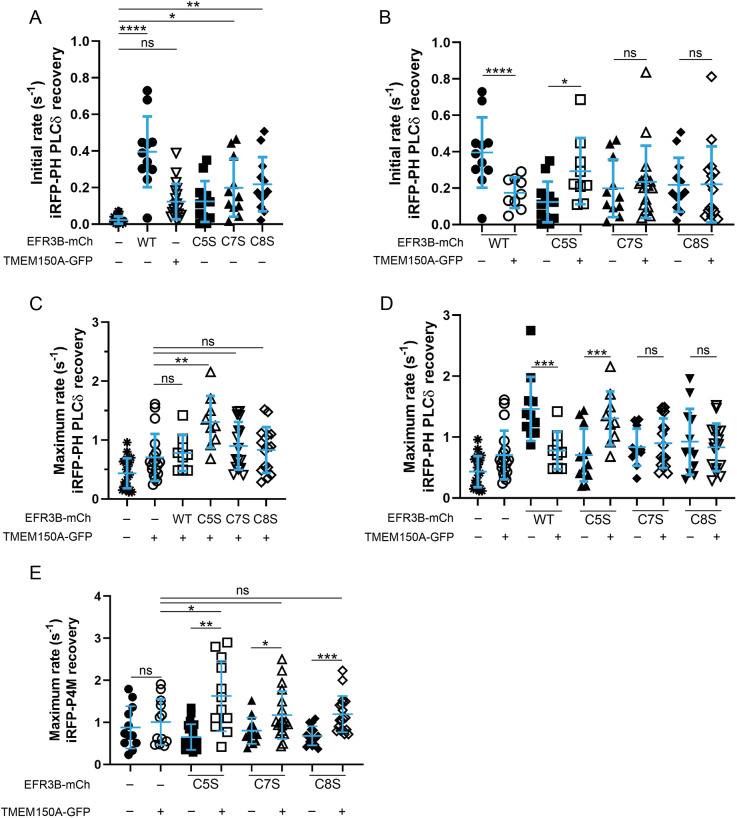
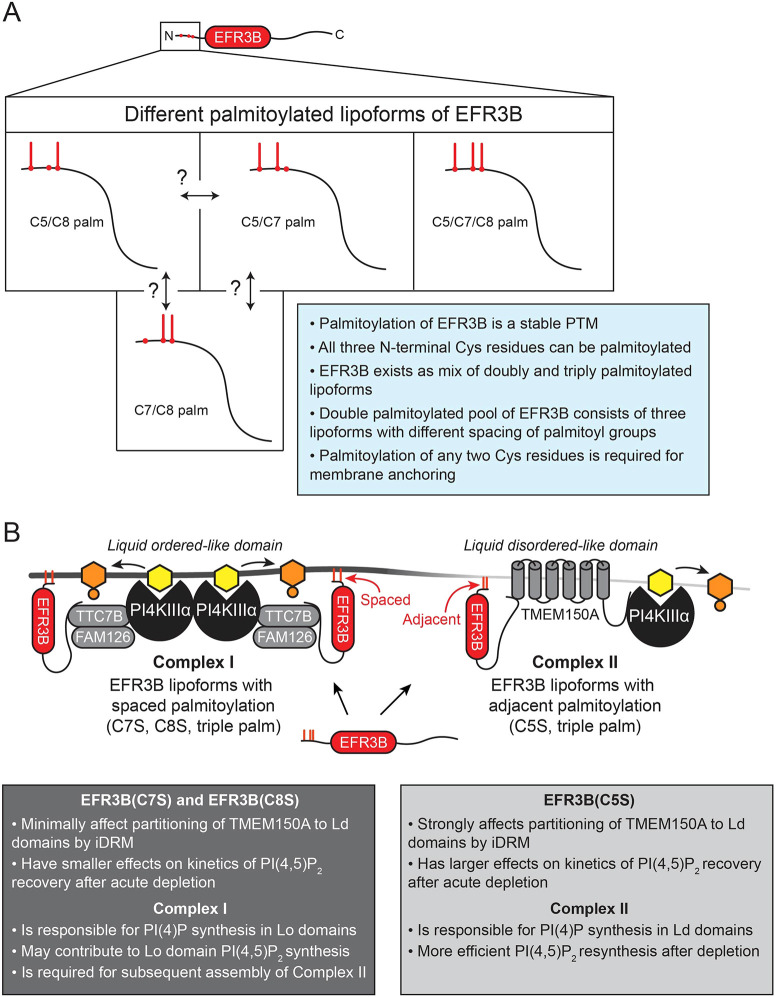
Phosphatidylinositol 4-kinase IIIα (PI4KIIIα) is the major enzyme responsible for generating phosphatidylinositol (4)-phosphate [PI(4)P] at the plasma membrane. This lipid kinase forms two multicomponent complexes, both including a palmitoylated anchor, EFR3. Whereas both PI4KIIIα complexes support production of PI(4)P, the distinct functions of each complex and mechanisms underlying the interplay between them remain unknown. Here, we present roles for differential palmitoylation patterns within a tri-cysteine motif in EFR3B (Cys5, Cys7 and Cys8) in controlling the distribution of PI4KIIIα between these two complexes at the plasma membrane and corresponding functions in phosphoinositide homeostasis. Spacing of palmitoyl groups within three doubly palmitoylated EFR3B 'lipoforms' affects both interactions between EFR3B and TMEM150A, a transmembrane protein governing formation of a PI4KIIIα complex functioning in rapid phosphatidylinositol (4,5)-bisphosphate [PI(4,5)P2] resynthesis following phospholipase C signaling, and EFR3B partitioning within liquid-ordered and -disordered regions of the plasma membrane. This work identifies a palmitoylation code involved in controlling protein-protein and protein-lipid interactions that affect a plasma membrane-resident lipid biosynthetic pathway.

Keywords: EFR3; Membrane microdomains; PI(4)P; PI4KIIIα; Palmitoylation; Phosphoinositides; TMEM150A.


Conflict of interest statement

Competing interests The authors declare no competing or financial interests.

Figures

Fig. 1.
Fig. 1.
Dual palmitoylation of EFR3B is required for its PM localization. (A) Diagram illustrating the current understanding of the assembly of PI4KIIIα into two complexes (Complex I and Complex II) at the PM. The sequence of the N-terminal Cys-rich motif of EFR3B is shown, with Cys residue positions highlighted. (B) Representative confocal microscopy images of WT and mutant EFR3B–mCherry expressed in HeLa cells. Traces underneath each image indicate fluorescence intensity along the line indicated in the image, to illustrate the presence or absence of discernible PM fluorescence. Images were considered representative if more than 90% of cells imaged (n=20) showed the same localization. Scale bars: 15 µm. (C) Representative confocal microscopy images of TTC7B–GFP showing its recruitment by WT or CxS mutant EFR3B–mCherry. Images are representative of n=20. Scale bars: 15 µm. (D) APE assay to quantify the extent of palmitoylation of various EFR3B–3×FLAG mutants, with a calnexin positive control (bottom) and omission of hydroxylamine as a negative control. EFR3B or calnexin species with zero, one, two or three PEG groups are indicated by the presence of –, *, **, or ***, respectively. A sample of lysate prior to APE was analyzed to show input (FLAG input). Higher intensity exposures of the same blots shown on the right reveal the palmitoylation state of EFR3B(C5,7,8S). The position of a 100 kDa size marker is indicated. Blots are representative of five experiments. (E,F) Bioorthogonal metabolic labeling pulse-chase experiment with alk-16 [16 h pulse, 0–6 h chase in presence of cycloheximide and lactacystin (Cyclo/Lact) to prevent protein synthesis and degradation] showing that EFR3B–3×FLAG palmitoylation is stable over several hours. (E) In-gel fluorescence (Cy5.5, extent of EFR3B–3×FLAG palmitoylation) and western blot (total EFR3B–3×FLAG). (F) Quantification of normalized data (mean±s.d. of n=3). Statistical significance was determined using a two-tailed unpaired Student's t-test. ns, not significant.
Fig. 2.
Fig. 2.
EFR3B interacts with TMEM150A, and the membrane dynamics of WT and CxS mutant EFR3B are similar. (A) FRAP recovery times (t1/2) of EFR3B–GFP with or without TMEM150A–mCherry (TMEM150A–mCh). The increase in the recovery time of EFR3B in the presence of TMEM150A suggests an interaction between the two proteins. (B) FRAP recovery times (t1/2) of TMEM150A–GFP with or without EFR3B–mCherry (EFR3B–mCh). Note that the recovery times of co-expressed TMEM150A and EFR3B move closer to each other (compare A and B). (C) Mobile fraction of EFR3B–GFP or TMEM150A–GFP when expressed alone or together as evaluated by FRAP. (D) Diffusion coefficients of EFR3B–GFP and TMEM150A–GFP, expressed separately, as measured by ImFCS. Data are pooled from three independent experiments, n=15–16 cells. (E) Recovery times (t1/2) of WT EFR3B–GFP and individual EFR3B–GFP or EFR3B–mNG CxS mutants with or without TMEM150A–mCherry. Note that the CxS mutations have no effect on the membrane diffusion of EFR3B and are insensitive to the presence of TMEM150A. (F) Recovery time (t1/2) of TMEM150A–GFP expressed alone or in the presence of WT or CxS mutant EFR3B–mCherry. Note that the CxS mutants have the same effect on TMEM150A–GFP recovery time as WT EFR3B. To improve clarity and facilitate comparisons between effects of single or co-expression, the data in A and B are also plotted in E and F, respectively. Data in A–C,E,F are mean±s.d., n=14–27. **P<0.01; ***P<0.005; ****P<0.001; ns, not significant (two-tailed unpaired t-test in A and B; one-way ANOVA with Tukey–Kramer post-hoc test in C,E and F).
Fig. 3.
Fig. 3.
TMEM150A preferentially interacts with EFR3B(C5S) to form Complex II. (A) Diagram illustrating the workflow of the iDRM assay. All iDRM experiments were performed in RBL-2H3 cells. (B) Representative images (two per condition) of RBL-2H3 cells expressing EFR3B–GFP treated with PBS (−TX-100) or 0.04% TX-100 (+TX-100). Images are for −Tx-100 top, 22×19 µm; for −Tx-100 bottom, 28×19 µm; for +Tx-100 top, 25×21 µm; for +Tx-100 bottom, 28×20 µm. (C) Quantification of iDRM experiments on EFR3B–GFP (WT or CxS mutants) or EFR3B–mNG (for the C7S mutant) in the presence and absence of TMEM150A–mCherry (TMEM150A–mCh), with the R value (fraction of retained fluorescence) plotted. Note that WT EFR3B exhibits a strong increase in detergent resistance in the presence of TMEM150A–mCherry. However, the EFR3B(CxS) palmitoylation mutants do not. (D) Quantification of iDRM experiments on TMEM150A–GFP in the presence of EFR3B–mCherry (EFR3B–mCh; WT or indicated CxS mutants) or the indicated tagged Complex II components. In C and D, each data point represents the mean R value from 30 +TX-100 cells and 30 –TX-100 cells. Mean±s.d. of n=3 is indicated. *P<0.05; **P<0.01; ****P<0.001; ns, not significant (two-tailed unpaired t-test in C; one-way ANOVA with Tukey–Kramer post-hoc test in D).
Fig. 4.
Fig. 4.
Experimental setup for studies to quantify PI(4,5)P2 recovery kinetics after acute depletion. (A) Diagram representing the M1R-mediated PI(4,5)P2 depletion system. DAG, diacylglycerol; IP3, inositol trisphosphate. (B) Top: representative curve (red line is raw data and black line is smoothed curve) depicting the cytosolic fluorescence of the PI(4,5)P2 biosensor iRFP–PH(PLCδ) over time, with corresponding confocal micrographs of a cell expressing iRFP–PH(PLCδ) at the indicated timepoints. Scale bars: 15 µm. Bottom: the rate of change of fluorescence for the cytosolic fluorescence curve shown above. The region highlighted by the orange box is shown in the expanded panel and depicts the relevant time period, post-addition of atropine, for determination of relevant kinetics parameters, which are defined on the right [initial rate of PI(4,5)P2 resynthesis and maximum rate of PI(4,5)P2 resynthesis]. A.U., arbitrary units.
Fig. 5.
Fig. 5.
EFR3B(C5S)–TMEM150A interactions facilitate a more rapid recovery of PI(4)P and PI(4,5)P2 homeostasis than those of other palmitoylated forms of EFR3B. (A–D) HeLa cells were transfected with iRFP–PH(PLCδ), M1R–3×FLAG, and the indicated combination of TMEM150A–GFP and EFR3B–mCherry (EFR3B–mCh) variant (WT or CxS mutant). A time-lapse movie was acquired, recording iRFP fluorescence over time. Shown are kinetics parameters during the post-atropine phase (see Fig. 4): the initial rate of PI(4,5)P2 recovery (A,B) and maximum rate of PI(4,5)P2 recovery (C,D). Note that, to improve clarity and facilitate comparisons between effects of either EFR3B mutants alone or co-expressed with TMEM150A, the EFR3B–mCh only data in A are also plotted in B, and all data in C are also plotted in D. (E) Maximum rate of PI(4)P recovery in the presence of the indicated EFR3B and TMEM150A proteins, monitored by the recovery of the PI(4)P biosensor iRFP–P4M to the PM after M1R-mediated depletion. Mean±s.d. are indicated, n=9–21. *P<0.05; **P<0.025; ***P<0.01; ****P<0.001; ns, not significant (two-tailed unpaired t-test in B,D,E for comparisons between two groups; one-way ANOVA with Tukey–Kramer post-hoc test in A,C,E for comparisons between multiple groups).
Fig. 6.
Fig. 6.
Model for the regulation of PI4KIIIα complexes. (A) Schematic of the EFR3B N terminus and its multiple lipoforms (PTM, post-translational modification). (B) Model for the regulation of the formation of the two distinct PI4KIIIα complexes. PI is shown in yellow; PI(4)P is shown in orange. Palm, palmitoylation.

References

    1. Abrami, L., Dallavilla, T., Sandoz, P. A., Demir, M., Kunz, B., Savoglidis, G., Hatzimanikatis, V. and van Der Goot, F. G. (2017). Identification and dynamics of the human ZDHHC16-ZDHHC6 palmitoylation cascade. Elife 6, 1-24. 10.7554/eLife.27826 - DOI - PMC - PubMed
    1. Audhya, A. and Emr, S. D. (2002). Stt4 PI 4-kinase localizes to the plasma membrane and functions in the Pkc1-mediated MAP kinase cascade. Dev. Cell 2, 593-605. 10.1016/S1534-5807(02)00168-5 - DOI - PubMed
    1. Bag, N. and Wohland, T. (2014). Imaging fluorescence fluctuation spectroscopy: new tools for quantitative bioimaging. Annu. Rev. Phys. Chem. 65, 225-248. 10.1146/annurev-physchem-040513-103641 - DOI - PubMed
    1. Bag, N., Holowka, D. A. and Baird, B. A. (2020). Imaging FCS delineates subtle heterogeneity in plasma membranes of resting mast cells. Mol. Biol. Cell 31, 709-723. 10.1091/mbc.E19-10-0559 - DOI - PMC - PubMed
    1. Bag, N., Wagenknecht-wiesner, A., Lee, A., Shi, S. M. and Holowka, D. A. (2021). Lipid-based and protein-based interactions synergize transmembrane signaling stimulated by antigen clustering of IgE receptors. Proc. Natl. Acad. Sci. USA 118, 1-12. 10.1073/pnas.2026583118 - DOI - PMC - PubMed

Publication types

MeSH terms

Substances