Individual- and Community-Level Factors Associated With Detectable and Elevated Blood Lead Levels in US Children: Results From a National Clinical Laboratory
- PMID: 34570188
- PMCID: PMC8477303
- DOI: 10.1001/jamapediatrics.2021.3518
Individual- and Community-Level Factors Associated With Detectable and Elevated Blood Lead Levels in US Children: Results From a National Clinical Laboratory
Abstract
Importance: No safe level of exposure to lead has been identified.
Objective: To evaluate individual- and community-level factors associated with detectable and elevated blood lead levels (BLLs) in children.
Design, setting, and participants: This cross-sectional, retrospective study analyzed deidentified results from blood lead tests performed at a large clinical laboratory from October 1, 2018, to February 29, 2020. Participants were 1 141 441 children younger than 6 years living in all 50 US states and the District of Columbia who underwent blood lead testing during the study period. Children who underwent lead testing of unknown source and those with elevated BLLs who received capillary blood lead testing without confirmatory venous testing were excluded.
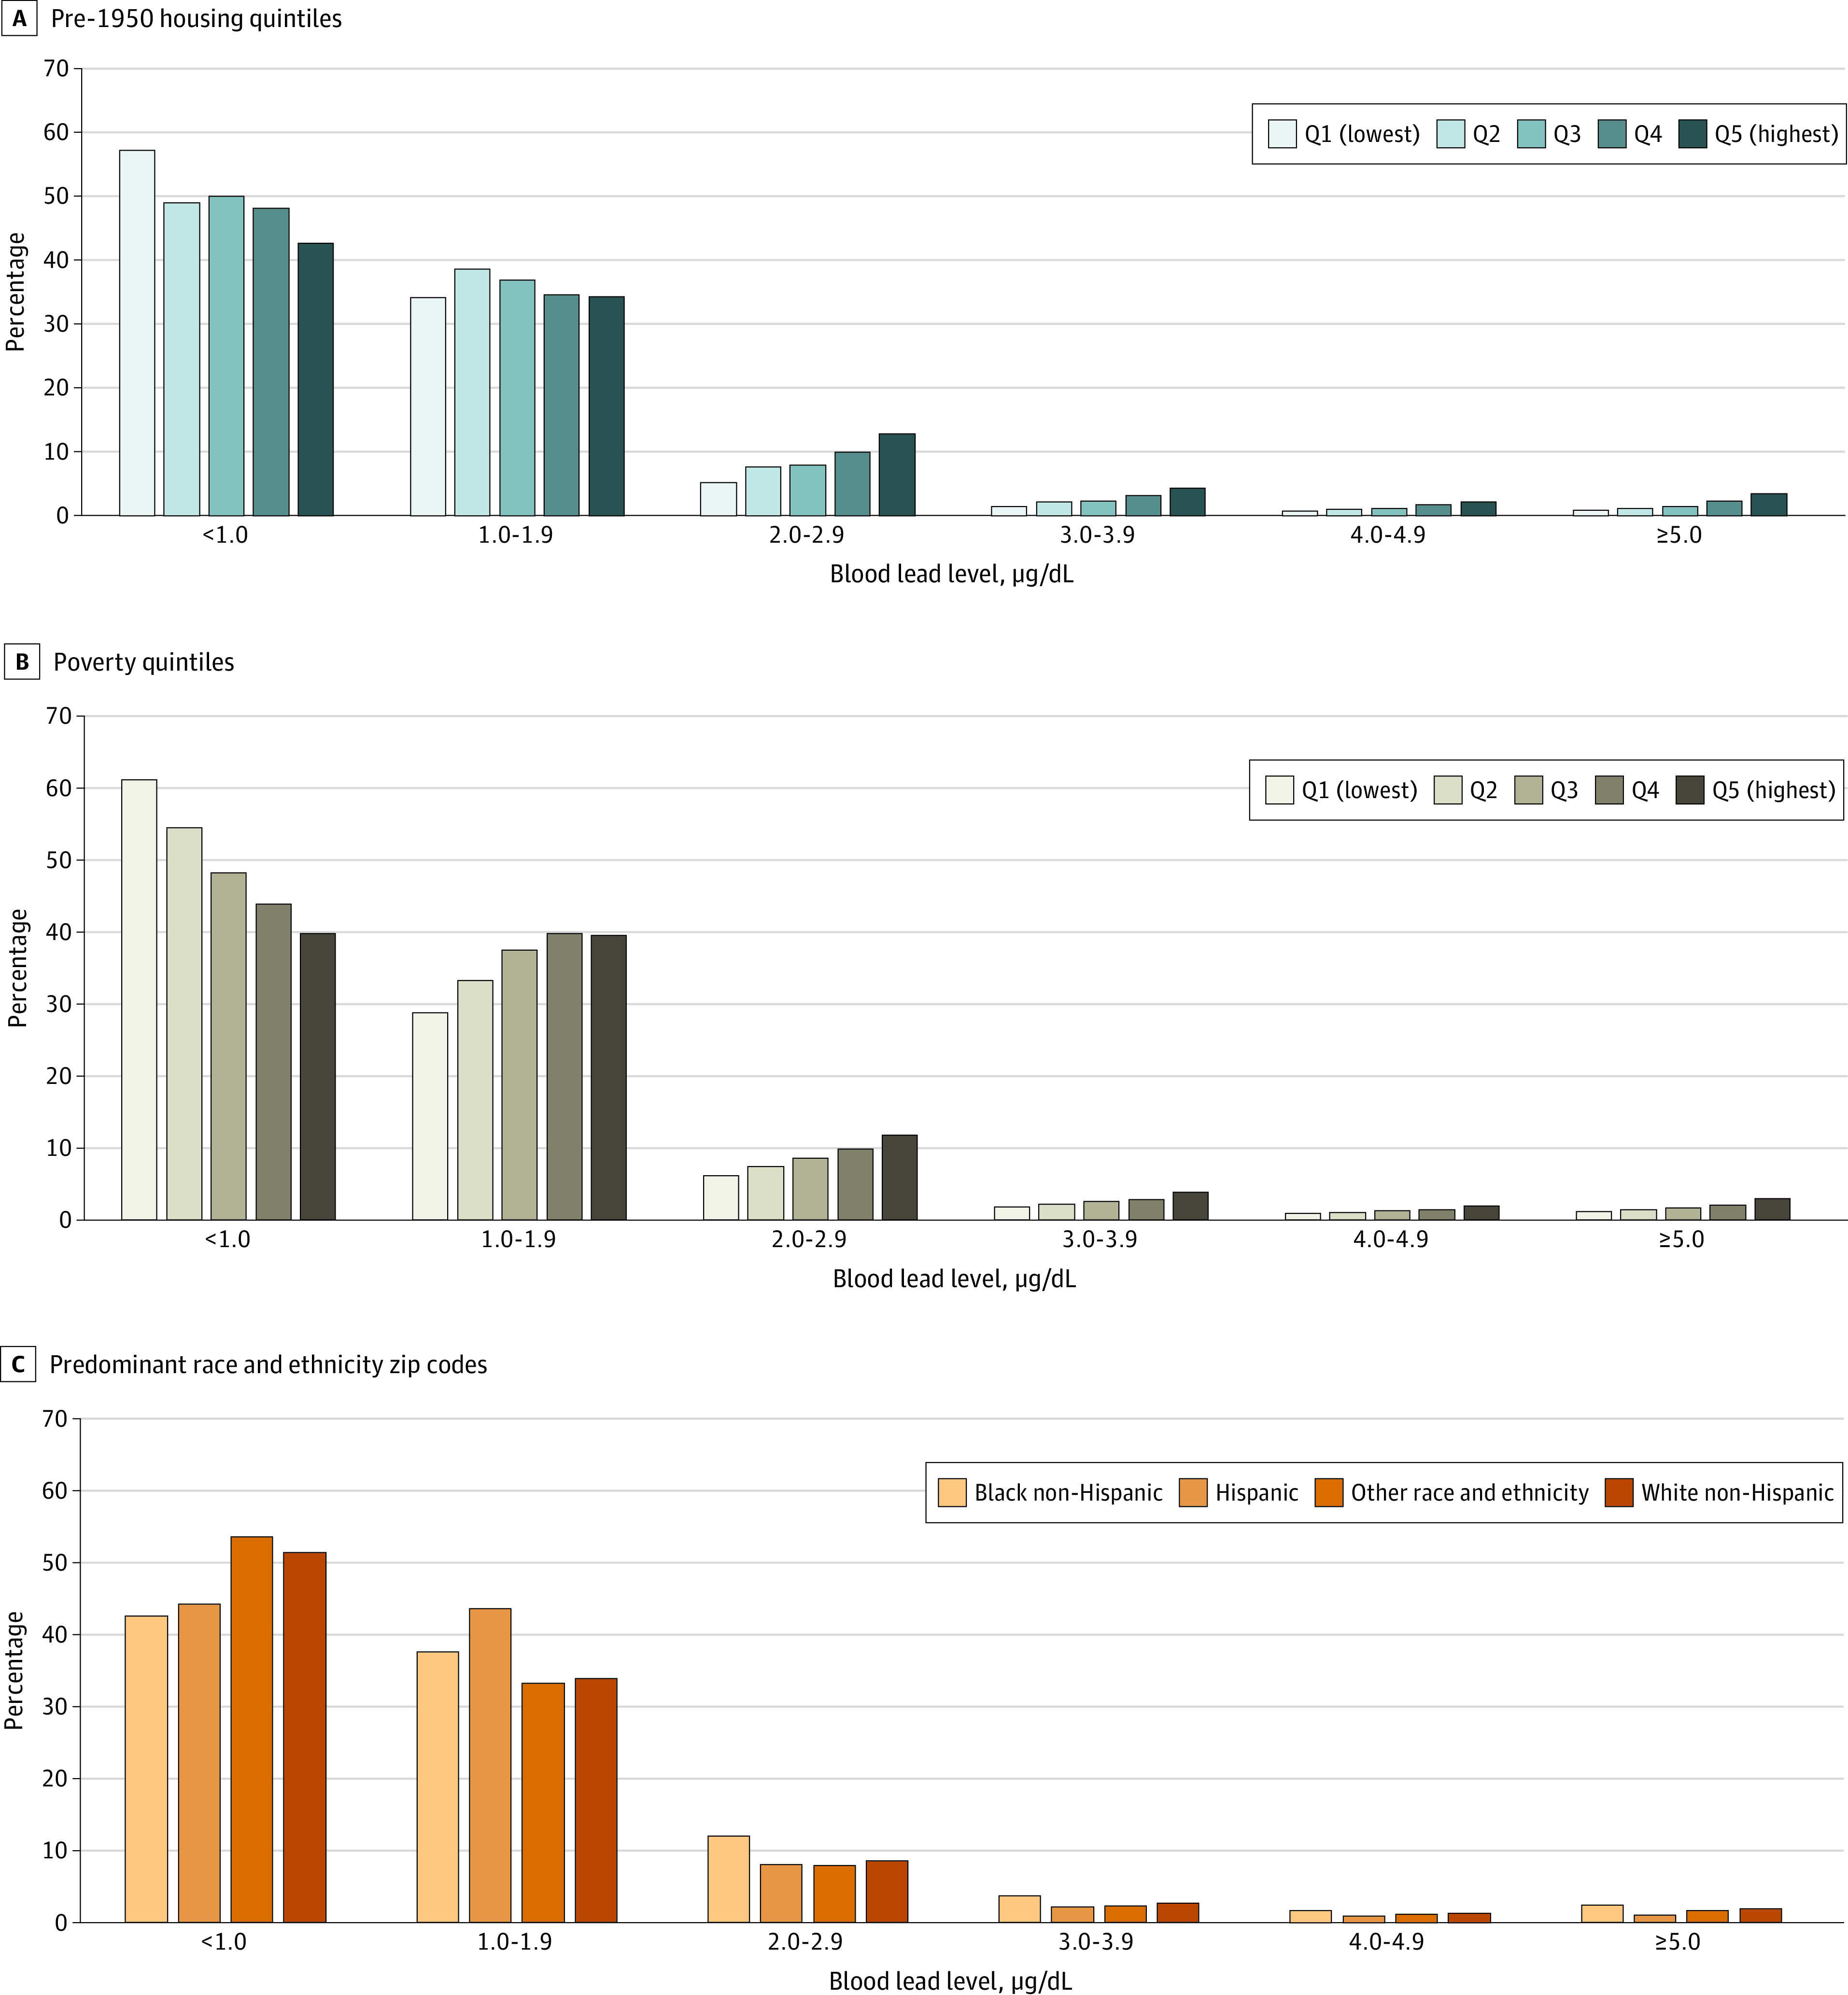
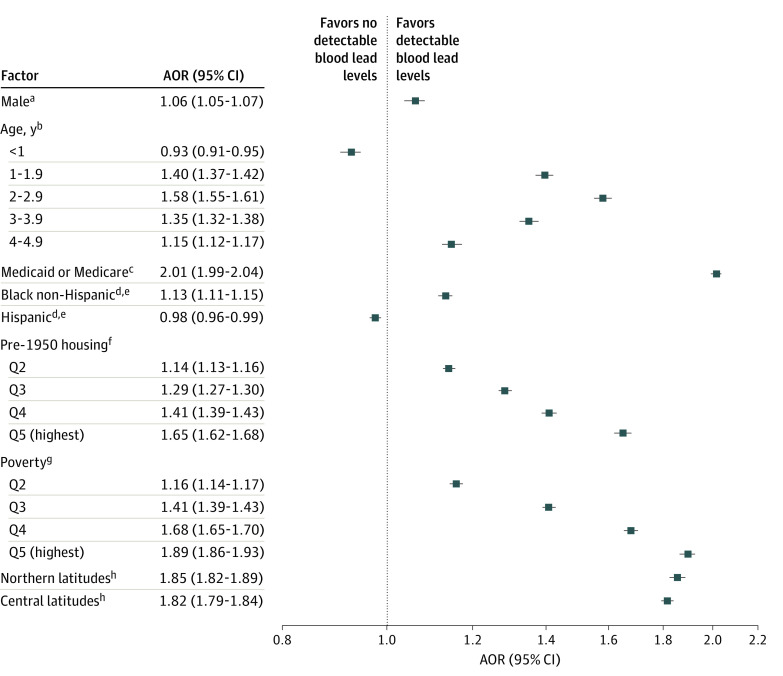
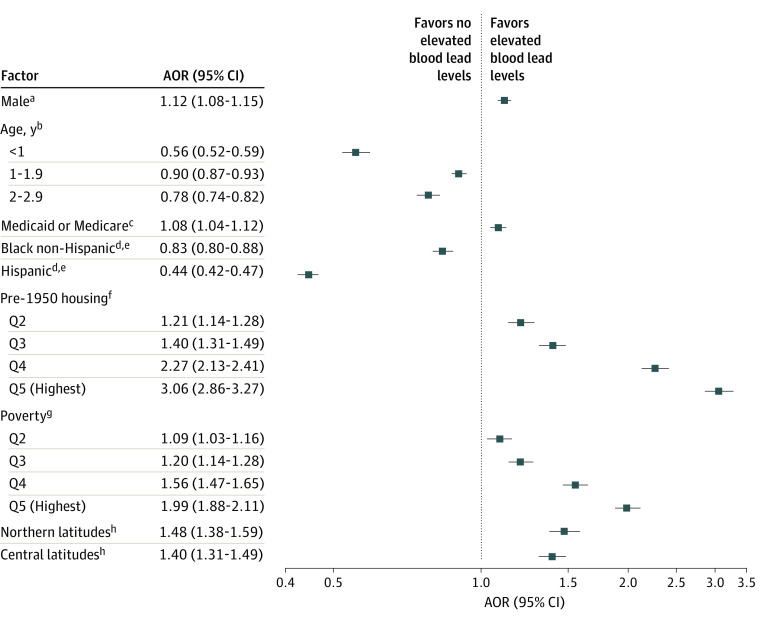
Exposures: Individual demographic categories included sex, age, and insurance type; community-level demographic categories included pre-1950s housing, poverty, predominant race and ethnicity, and geographical regions.
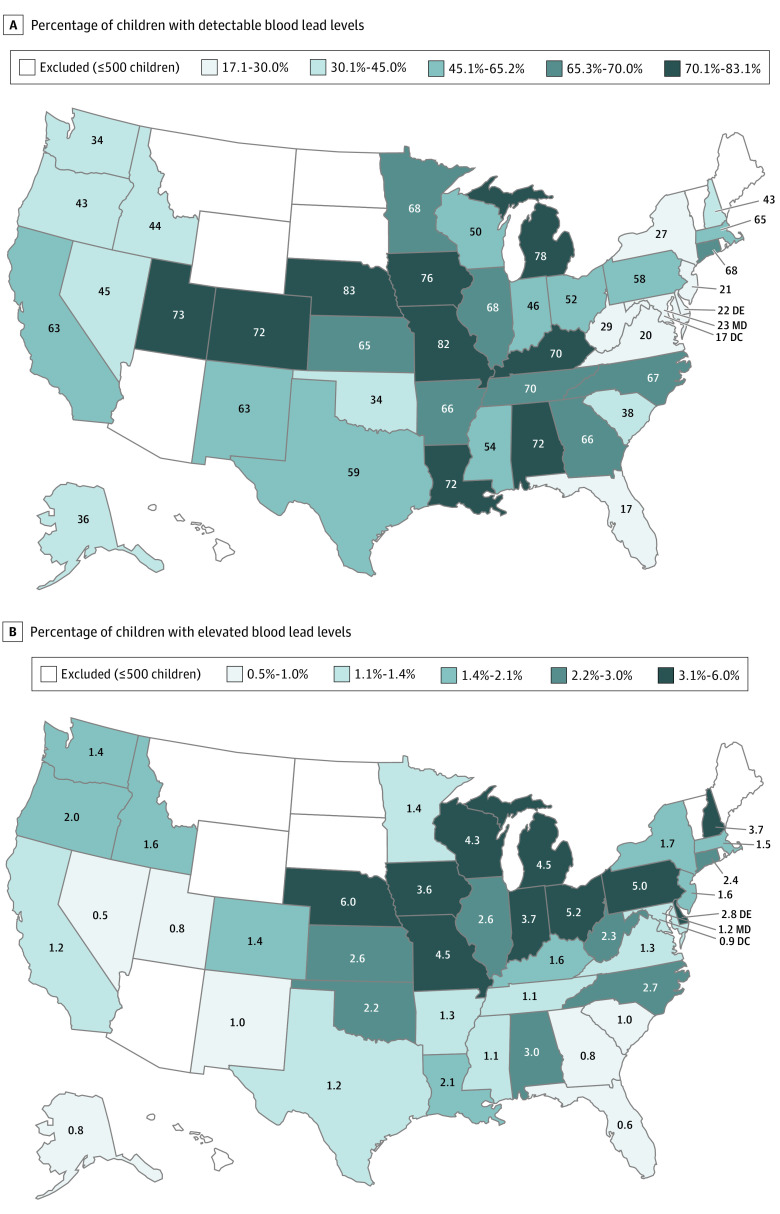
Main outcomes and measures: Proportions of children with detectable (≥1.0 μg/dL) and elevated (≥5.0 μg/dL) BLLs, by exposure category.
Results: Of the 1 141 441 children (586 703 boys [51.4%]; mean [SD] age, 2.3 [1.4] years) in the study, more than half of the children tested (576 092 [50.5%; 95% CI, 50.4%-50.6%]) had detectable BLLs, and 21 172 children (1.9% [95% CI, 1.8%-1.9%]) had BLLs of 5.0 μg/dL or more. In multivariable analyses, children with public insurance had greater odds of having detectable BLLs (adjusted odds ratio [AOR], 2.01 [95% CI, 1.99-2.04]) and elevated BLLs (AOR, 1.08 [95% CI, 1.04-1.12]). The proportion of children with detectable and elevated BLLs increased significantly for progressive pre-1950s housing and poverty quintiles (P < .001). The odds of detectable BLLs were significantly higher among children in the highest vs lowest quintile of pre-1950s housing (AOR, 1.65 [95% CI, 1.62-1.68]) and of poverty (AOR, 1.89 [95% CI, 1.86-1.93]). A similar association was found for those with elevated BLLs, with an AOR of 3.06 (95% CI, 2.86-3.27) for the highest vs lowest quintile of pre-1950 housing and 1.99 (95% CI, 1.88-2.11) for the highest quintile of poverty. Children residing in zip codes with predominantly Black non-Hispanic and non-Latinx populations had higher odds of detectable BLLs (AOR, 1.13 [95% CI, 1.11-1.15]) but lower odds for elevated BLL (AOR, 0.83 [95% CI, 0.80-0.88]).
Conclusions and relevance: This study suggests that, despite progress in reducing pediatric lead exposure, substantial individual- and community-level disparities persist.
Conflict of interest statement
Figures
Comment in
-
It's Time to End Lead Poisoning in the United States.JAMA Pediatr. 2021 Dec 1;175(12):1216-1217. doi: 10.1001/jamapediatrics.2021.3525. JAMA Pediatr. 2021. PMID: 34570192 No abstract available.
-
Early Detection in Childhood Lead Exposure Relies on Timely Testing-Reply.JAMA Pediatr. 2022 Mar 1;176(3):327-328. doi: 10.1001/jamapediatrics.2021.5764. JAMA Pediatr. 2022. PMID: 35040908 No abstract available.
-
Early Detection in Childhood Lead Exposure Relies on Timely Testing.JAMA Pediatr. 2022 Mar 1;176(3):327. doi: 10.1001/jamapediatrics.2021.5761. JAMA Pediatr. 2022. PMID: 35040909 No abstract available.
References
-
- Nigg JT, Nikolas M, Mark Knottnerus G, Cavanagh K, Friderici K. Confirmation and extension of association of blood lead with attention-deficit/hyperactivity disorder (ADHD) and ADHD symptom domains at population-typical exposure levels. J Child Psychol Psychiatry. 2010;51(1):58-65. doi:10.1111/j.1469-7610.2009.02135.x - DOI - PMC - PubMed
-
- National Toxicology Program, US Department of Health and Human Services . NTP monograph: health effects of low-level lead. Accessed February 25, 2021. https://ntp.niehs.nih.gov/ntp/ohat/lead/final/monographhealtheffectslowl...
Publication types
MeSH terms
Substances
Grants and funding
LinkOut - more resources
Full Text Sources
Medical