. 2021 Nov 1;220(11):e202005085.
doi: 10.1083/jcb.202005085. Epub 2021 Sep 27.

Hematopoietic progenitors polarize in contact with bone marrow stromal cells in response to SDF1

Affiliations

Hematopoietic progenitors polarize in contact with bone marrow stromal cells in response to SDF1

Thomas Bessy et al. J Cell Biol. .

Abstract

The fate of hematopoietic stem and progenitor cells (HSPCs) is regulated by their interaction with stromal cells in the bone marrow. However, the cellular mechanisms regulating HSPC interaction with these cells and their potential impact on HSPC polarity are still poorly understood. Here we evaluated the impact of cell-cell contacts with osteoblasts or endothelial cells on the polarity of HSPC. We found that an HSPC can form a discrete contact site that leads to the extensive polarization of its cytoskeleton architecture. Notably, the centrosome was located in proximity to the contact site. The capacity of HSPCs to polarize in contact with stromal cells of the bone marrow appeared to be specific, as it was not observed in primary lymphoid or myeloid cells or in HSPCs in contact with skin fibroblasts. The receptors ICAM, VCAM, and SDF1 were identified in the polarizing contact. Only SDF1 was independently capable of inducing the polarization of the centrosome-microtubule network.


Figures

Figure 1.
Figure 1.
Bone-marrow-on-a-chip allows the monitoring of HSPCs in contact with mesenchymal stem cells in 3D hydrogels. (A) Plan of the microfluidic chip: it comprises the endosteal (2) and the vascular (4) compartments, the HSPC injection channel (3), the cytokine-secreting fibroblast compartment (5), and channels for medium circulation (1 and 6). The inset describes the organization of the central channels loaded with cells. (B) Left: Transmitted light image of the three central channels. Right: Colorized individual trajectories of HSPCs during a time-lapse sequence. Scale bar = 200 µm. (C) Maximum projection of 10-µm-wide Z stack confocal images of HSPCs in the endosteal (upper panel) and vascular (lower panel) compartments. HSPCs (CD34+) appear in green, actin structures in red, DNA in blue, and centrosomes in white. Scale bar = 10 µm. (D) Selected Z stacks of HSPCs in the endosteal and vascular compartments are presented in the upper and lower panel, respectively. The HSPC centrosome can be defined relative to the point of contact of the HSPC with the osteoblast or endothelial cell (marked with a white arrow) as proximal (left), in an intermediate position (middle), or distal (right). Actin appears in green, centrosome in white, and DNA in blue. Scale bar = 10 µm. Right: Distribution of HSPCs with proximal, intermediate, or distal centrosome in the vascular (n = 73) and endosteal (n = 199) compartments from three independent experiments. Error bars represent SD.
Figure S1.
Figure S1.
Microwell manufacturing. (A) A PDMS stamp (purple) was placed in contact with a silanized glass coverslip (gray). The acrylamide and bis-acrylamide mix (black) filled by capillarity the gap between the PDMS and the glass coverslip. The sandwich was exposed to UV for 5 min to polymerize the PAA. After removal of the PDMS mold, the glass bottom was functionalized by binding proteins to the silane (red). Left inset: Representative image of fluorescent fibrinogen in the wells. Scale bar = 50 µm. (B) Left: Schematic representation of the coating system in microwells. Protein A (in blue) was first coated on the coverslip (in gray). SDF1 linked to a fragment crystallizable (FC) domain, which binds to Protein A, was added on top. The ability of SDF1-FC (in green) to induce HSPC (in salmon) polarization was tested. Right: Fluorescent rabbit and goat secondary antibodies (AB) were used to validate Protein A coating in microwells. As a negative control, goat AB (in green) does not label Protein A: no fluorescence was detected in the absence or in presence of Protein A. In contrast, fluorescence was detected upon Protein A coating using rabbit AB (in blue), which does react with Protein A. This test validated Protein A coating in the microwells. (C) Representative image of Protein A coating (blue) detected by rabbit AB and SDF1-FC (green) attached to Protein A in a microwell. Scale bar = 10 µm.
Figure 2.
Figure 2.
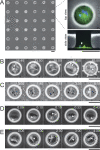
Array of microwells to control HSPC–mesenchymal stem cell interaction. (A) Transmitted light images of the PAA stencil showing the 50-µmwide circular holes seeded with osteoblasts and HSPCs (left). Images of top (upper right) and side (lower right) views of a single microwell containing fixed cells, stained for tubulin in green and DNA in blue. Fluorescent dextran was incorporated in the PAA mix to reveal the microwell (white). HSPCs were identified by small size and round shape (white arrowhead), whereas osteoblasts were larger and spread at the bottom of the microwell. (B–E) Time-lapse monitoring with transmitted light of live HSPCs (white arrowheads) in contact with osteoblasts (time indicated in hours:minutes). (B) Representative image of HSPC in proliferation. (C) Representative image of HSPC engaged in migration and confinement below osteoblasts (highlighted with black arrowheads). (D) Representative HSPC engaged in adhesion onto a moving osteoblast. (E) Long-term anchoring of an HSPC on an osteoblast (see corresponding Video 2). Scale bars = 50 µm.
Figure 3.
Figure 3.
HSPCs polarize upon interaction with osteoblasts. (A) Representative confocal images of an HSPC cultured on an osteoblast in a microwell. Upper panel: Tilted 3D view. Lower panel: Lateral view. Actin appears in red, microtubules in green, DNA in blue, and centrosome in white. The HSPC is polarized, with its centrosome proximal to the point of contact with the osteoblast, highlighted with an arrow, as in all images. Scale bars = 5 µm. (B) Golgi organization in a polarized HSPC. Selected Z stacks of a representative cell. Upper panel: Golgi appears in red, actin in green, centrosome in white, and DNA in blue. Lower panel: Inverted image of the Golgi. Scale bar = 5 µm. (C) Microtubule organization in a polarized HSPC. Selected Z stacks of a representative cell. Upper panel: Microtubules appear in red, actin in green, centrosome in white, and DNA in blue. Lower panel: Inverted image of the microtubules. Scale bar = 5 µm. (D) Actin cytoskeleton organization in a polarized HSPC. Selected Z stacks of representative cells are presented. In all images, microtubules are in green and DNA in blue. First column: Actin appears in red in the upper panel, and the lower panel contains an inverted image of Actin. Second column: Arp2/3 appears in red in the upper panel, and the lower panel contains an inverted image of Arp2/3. Third column: Ezrin appears in red in the upper panel, and the lower panel contains an inverted image of Ezrin. Fourth column: phospho-myosin light chain appears in red in the upper panel and in black in the lower panel (inverted image). Scale bars = 5 µm. (E) Localization of CD133 in a polarized HSPC. Selected Z stacks of a representative cell. Upper panel: CD133 appears in red, actin in green, microtubules in white, and DNA in blue. Lower panel: Inverted image of CD133. Scale bar = 5 µm. (F) Localization of CD44 in a polarized HSPC. Selected Z stacks of a representative cell. Upper panel: CD44 appears in red, actin in green, centrosome in white, and DNA in blue. Lower panel: Inverted image of CD44. Scale bar = 5 µm. (G) Graphical summary of the localization of the factors described in a polarized HSPC.
Figure S2.
Figure S2.
Cytoskeleton architecture of HSPCs in adhesive and nonadhesive microwells. (A) Inverted images of selected Z stacks of two representative HSPC polarized on osteoblasts. Upper panel: Microtubules appear in black and the centrosome in red. Lower panel: Nucleus (DNA staining) appears in black. (B) Inverted images of selected Z stacks of actin organization in representative HSPCs polarized upon contact with osteoblast. The point of contact is highlighted with a black arrow. (C) Cytoskeleton architecture of HSPCs in a nonadhesive microwell. Selected Z stack (z = 0–10 µm) of a representative HSPC cultured in a PAA microwell (nonadhesive). Microtubules appear in green, centrosome in white, and DNA in blue. The centrosome was tightly associated with the nucleus, and not proximal to the glass bottom. Scale bar = 5 µm. (D) Inverted images of representative HSPCs cultured in PAA microwells. Upper panel: Microtubules appear in black and the centrosome in red. Lower panel: Corresponding image of the nucleus. Scale bar = 5 µm.
Figure 4.
Figure 4.
HSPCs polarize upon specific heterotypic interactions. (A) Schematic description of the experimental system to evaluate interactions between different stromal or nonstromal cell types of interest (listed in blue) and different hematopoietic cell types isolated at different stages of differentiation (listed in black). (B) As schematized, the HSPC polarization index (Pi) was defined as the ratio between the distance from the point of contact to the centrosome (d) and the HSPC length (D). Representative images of HSPCs with a Pi close to 0 (left) and or close to 1 (right). Actin filaments appear in red, microtubules in green, the centrosome in white, and DNA in blue. Arrowheads highlight the point of contact. Scale bar = 5 µm. (C) SuperPlot of the polarization index of HSPCs in contact with osteoblasts, endothelial cells, and skin fibroblasts. Each color represents a biological replicate (three replicates; osteoblasts hFOB ntotal = 135, endothelial cells HUVEC, ntotal = 178, and skin fibroblasts BJ, ntotal = 149). For each replicate, the median appears as a large diamond, triangle, or hexagon with the corresponding color. The mean of the medians appears as a black bar. ****, P < 0.0001; Kruskal–Wallis ANOVA. (D) SuperPlot of polarization index of HSPCs in contact with mouse liver–derived stromal cell lines that either support HSPC regeneration capacities (AFT024) or not (BFC012). Each color represents a biological replicate (three replicates; AFT, ntotal = 99; BFC, ntotal = 106). For each replicate, the median appears as a large diamond or triangle of the corresponding color. The mean of the medians appears as a black bar. ****, P < 0.0001; Kruskal–Wallis ANOVA. (E) SuperPlot of polarization index of HSCs (CD38, ntotal = 97), CMPs (CD38+/CD33+, ntotal = 140), primary human monocytes (CD14+, ntotal =85), nonactivated (CD3+, ntotal = 115) or activated (CD3+, ntotal = 138) T cells, and immortalized T lymphocytes (Jurkat cells, ntotal = 82) in contact with osteoblasts. Each color represents a biological replicate (three replicates). For each replicate, the median appears as a large hexagon, diamond, triangle, disk, square, or inverted triangle of the corresponding color. The mean of the medians appears as a black bar. ****, P < 0.0001; Kruskal–Wallis ANOVA. (F) Representative images of HSPC/CD34+ (upper left), monocyte (lower left), inactivated T cell (upper right,) and activated T cell (lower right) interacting with osteoblasts. Actin appears in red, centrosome in white, and DNA in blue. Arrowheads highlight the point of contact. Scale bar = 10 µm.
Figure S3.
Figure S3.
FACS isolation of HSC and CMP. FACS gating strategy to isolate, from the initial population of HSPCs (CD34+ cells), CD34+/CD38 cells (considered as more HSCs, in red), and CD34+/CD38+/CD33+ cells (CMPs, in black).
Figure 5.
Figure 5.
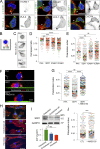
Engagement of SDF1/CXCR4 is sufficient to induce HSPC polarization. (A) Localization of ligand-receptor pairs in polarized HSPCs. Selected Z stacks of confocal images of representative cells. White arrows highlight the point of contact with the stromal cell. Actin appears in red and DNA in blue. Left: VCAM-1 and VLA-4 appear in green. Inverted images of VCAM-1 and VLA-4 are presented. Middle: ICAM-1 and LFA-1 appear in green. Inverted images of ICAM-1 and LFA-1 are presented. Right: CXCR4 and SDF1 appear in green. Inverted images of CXCR4 and SDF1 are presented. Scale bars = 5 µm. (B) Schematic illustration of an HSPC in a microwell coated with protein A (light green) and ligand of interest (dark green). Potentially engaged receptor is depicted in red. (C) Representative inverted images of microtubules highlighting the shape of HSPCs cultured in uncoated (PAA), SDF1-, ICAM-1–, or VCAM-1–coated microwells. Scale bar = 5 µm. (D) SuperPlot of the aspect ratios of the HSPCs cultured in microwells coated with the molecules of interest. The cell aspect ratio was calculated as the ratio of the lengths of the short and long axes of the cell. Each color represents a biological replicate (three replicates: PAA ntotal = 107, SDF1 ntotal = 228, ICAM-1 ntotal = 182, and VCAM-1 ntotal = 221). For each replicate, the median appears as a large diamond, triangle, hexagon, or disk with the corresponding color. The mean of the medians appears as a black bar. ***, P = 0.0006; Kruskal–Wallis ANOVA. (E) SuperPlot of the polarization index of HSPCs cultured in microwells coated with the molecules of interest. Each color represents a biological replicate (three replicates: PAA ntotal = 107; SDF1 ntotal = 228; ICAM-1 ntotal = 182, and VCAM-1 ntotal = 221). For each replicate, the median appears as a large diamond, triangle, hexagon, or disk with the corresponding color. The mean of the medians appears as a black bar. ****, P < 0.0001; Kruskal–Wallis ANOVA. (F) Orthogonal view of representative images of an HSPC cultured in microwells coated with PAA, SDF1-FC alone, and SDF1-FC in the presence of AMD3100 (100 µM). Actin appears in red, the centrosome in white, DNA in blue, and SDF1-FC in green. Scale bar = 5 µm. (G) SuperPlot of the polarization index of HSPCs cultured in microwells coated with PAA, SDF1-FC alone, and SDF1-FC in the presence of AMD3100 (100 µM). Each color represents a biological replicate (four replicates: PAA ntotal = 203; SDF1 ntotal = 231; and SDF1-FC + AMD3100 (100 µM) ntotal = 219). For each replicate, the median appears as a large diamond, triangle, or square with the corresponding color. The mean of the medians appears as a black bar. ****, P < 0.0001; Kruskal–Wallis ANOVA. (H) Representative images of osteoblasts (hFOB), endothelial cells (HUVEC), and fibroblasts (BJ) immunostained for SDF1 (in green). Actin appears in red and DNA in blue. Scale bar = 20 µm. (I) Upper panel: Representative immune blot performed on osteoblasts, endothelial cells, and fibroblast lysates, using anti-SDF1 and anti-GADPH antibodies. Lower panel: Quantification of the immunoblots from three independent experiments. The ratio of signal intensities of SDF1 on GADPH are normalized to the value obtained in osteoblasts. Mean values are presented. Errors bars are SD. *, P = 0.036; **, P = 0.006; unpaired t test. (J) SuperPlot of the polarization index of HSPCs cultured on osteoblasts in the absence (CTL) or presence of AMD3100 (100 µM). Each color represents a biological replicate (four replicates: CTL ntotal = 249 and AMD3100 ntotal = 266). For each replicate, the median appears as a large diamond, or triangle with the corresponding color. The mean of the medians appears as a black bar. ***, P = 0.0003; Mann–Whitney U test.

Comment in

References

    1. Alakel, N., Jing D., Muller K., Bornhauser M., Ehninger G., and Ordemann R.. 2009. Direct contact with mesenchymal stromal cells affects migratory behavior and gene expression profile of CD133+ hematopoietic stem cells during ex vivo expansion. Exp. Hematol. 37:504–513. 10.1016/j.exphem.2008.12.005 - DOI - PubMed
    1. Asada, N., Kunisaki Y., Pierce H., Wang Z., Fernandez N.F., Birbrair A., Ma’ayan A., and Frenette P.S.. 2017. Differential cytokine contributions of perivascular haematopoietic stem cell niches. Nat. Cell Biol. 19:214–223. 10.1038/ncb3475 - DOI - PMC - PubMed
    1. Bauer, N., Fonseca A.V., Florek M., Freund D., Jászai J., Bornhäuser M., Fargeas C.A., and Corbeil D.. 2008. New insights into the cell biology of hematopoietic progenitors by studying prominin-1 (CD133). Cells Tissues Organs. 188:127–138. 10.1159/000112847 - DOI - PubMed
    1. Bowers, M., Zhang B., Ho Y., Agarwal P., Chen C.C., and Bhatia R.. 2015. Osteoblast ablation reduces normal long-term hematopoietic stem cell self-renewal but accelerates leukemia development. Blood. 125:2678–2688. 10.1182/blood-2014-06-582924 - DOI - PMC - PubMed
    1. Bruns, I., Lucas D., Pinho S., Ahmed J., Lambert M.P., Kunisaki Y., Scheiermann C., Schiff L., Poncz M., Bergman A., and Frenette P.S.. 2014. Megakaryocytes regulate hematopoietic stem cell quiescence through CXCL4 secretion. Nat. Med. 20:1315–1320. 10.1038/nm.3707 - DOI - PMC - PubMed

Publication types

MeSH terms