. 2023 Apr;28(2):401-421.
doi: 10.1037/met0000407. Epub 2021 Sep 27.

Modeling individual differences in the timing of change onset and offset

Affiliations

Modeling individual differences in the timing of change onset and offset

Daniel McNeish et al. Psychol Methods. 2023 Apr.

Abstract

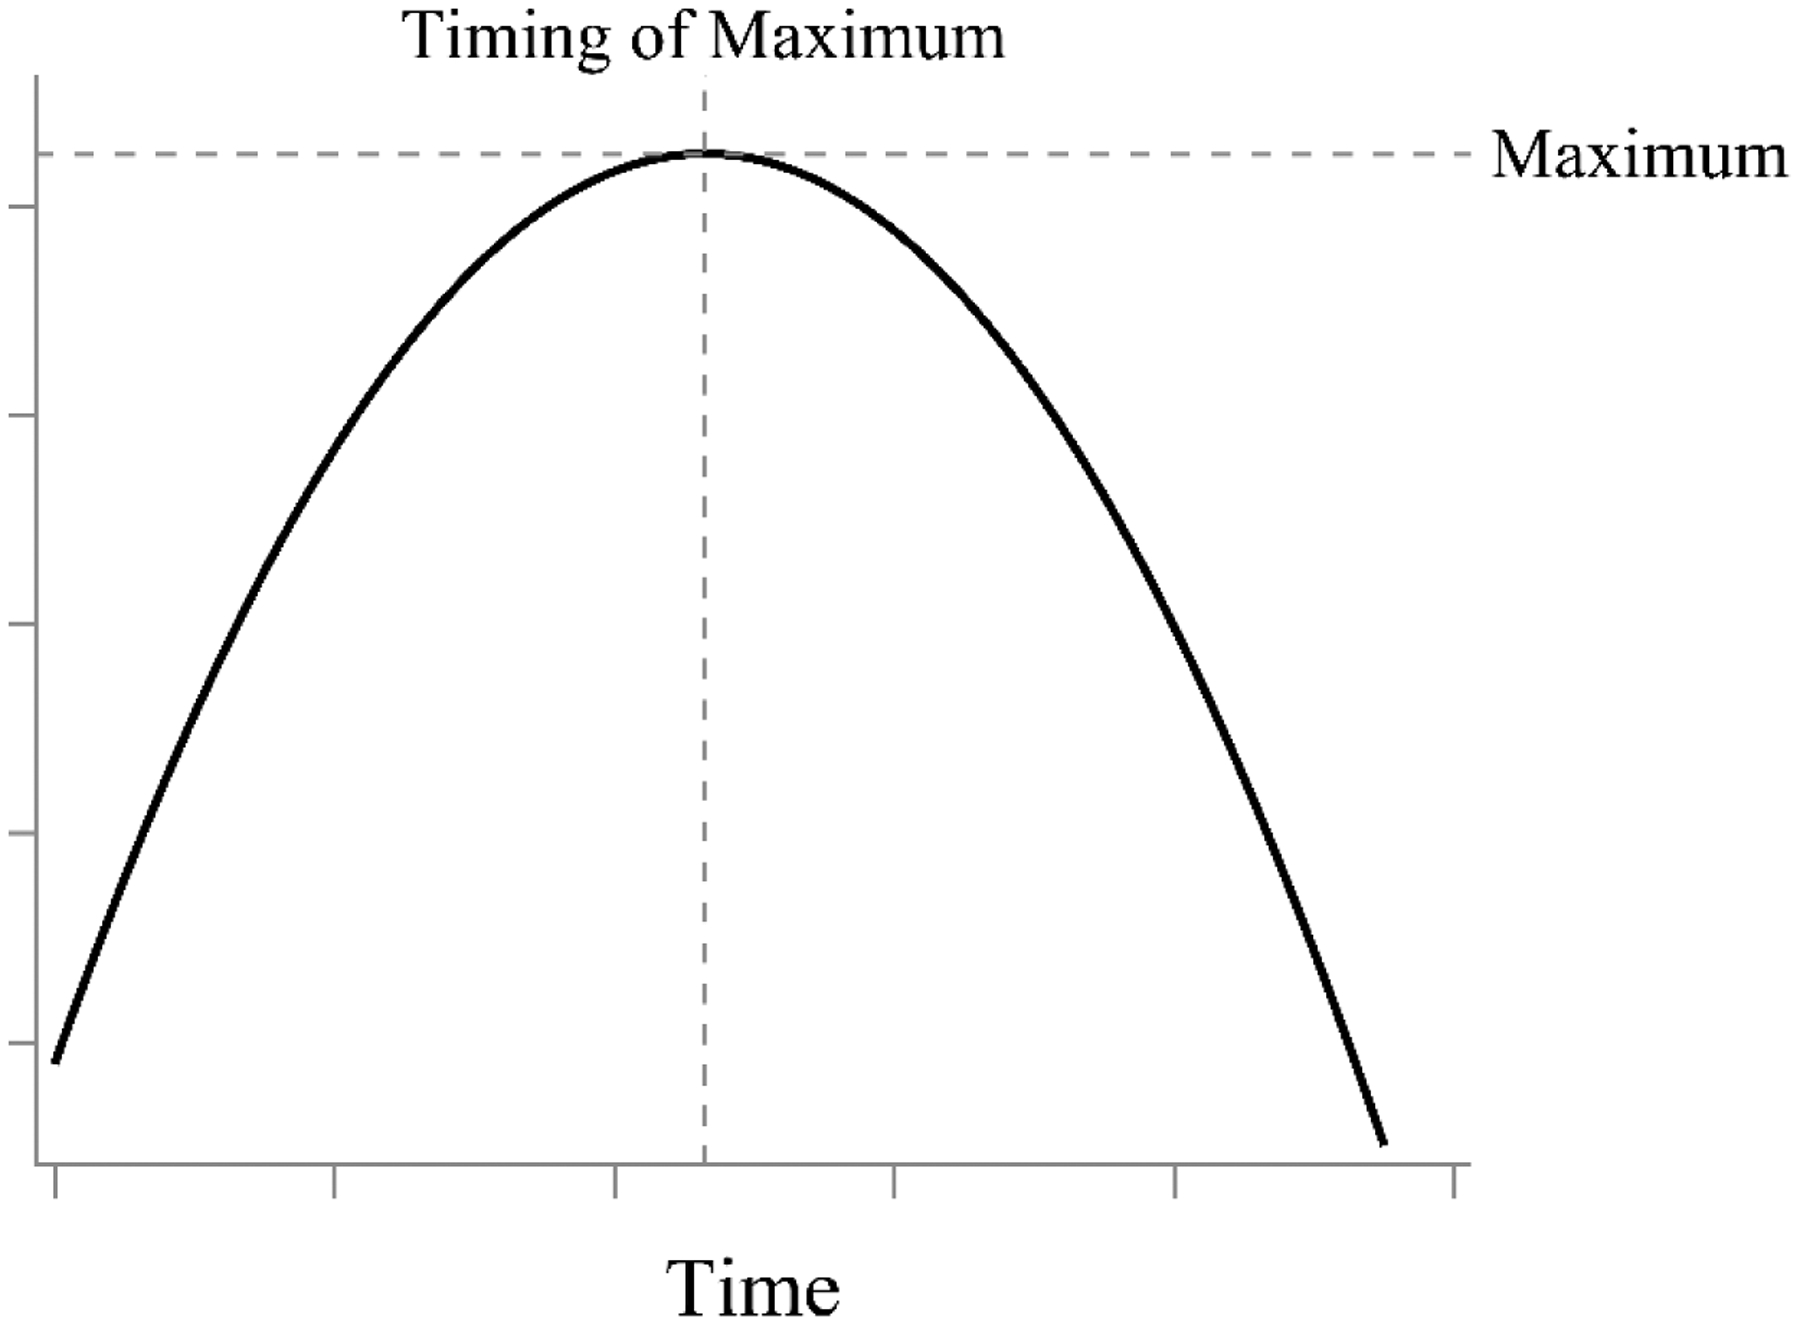
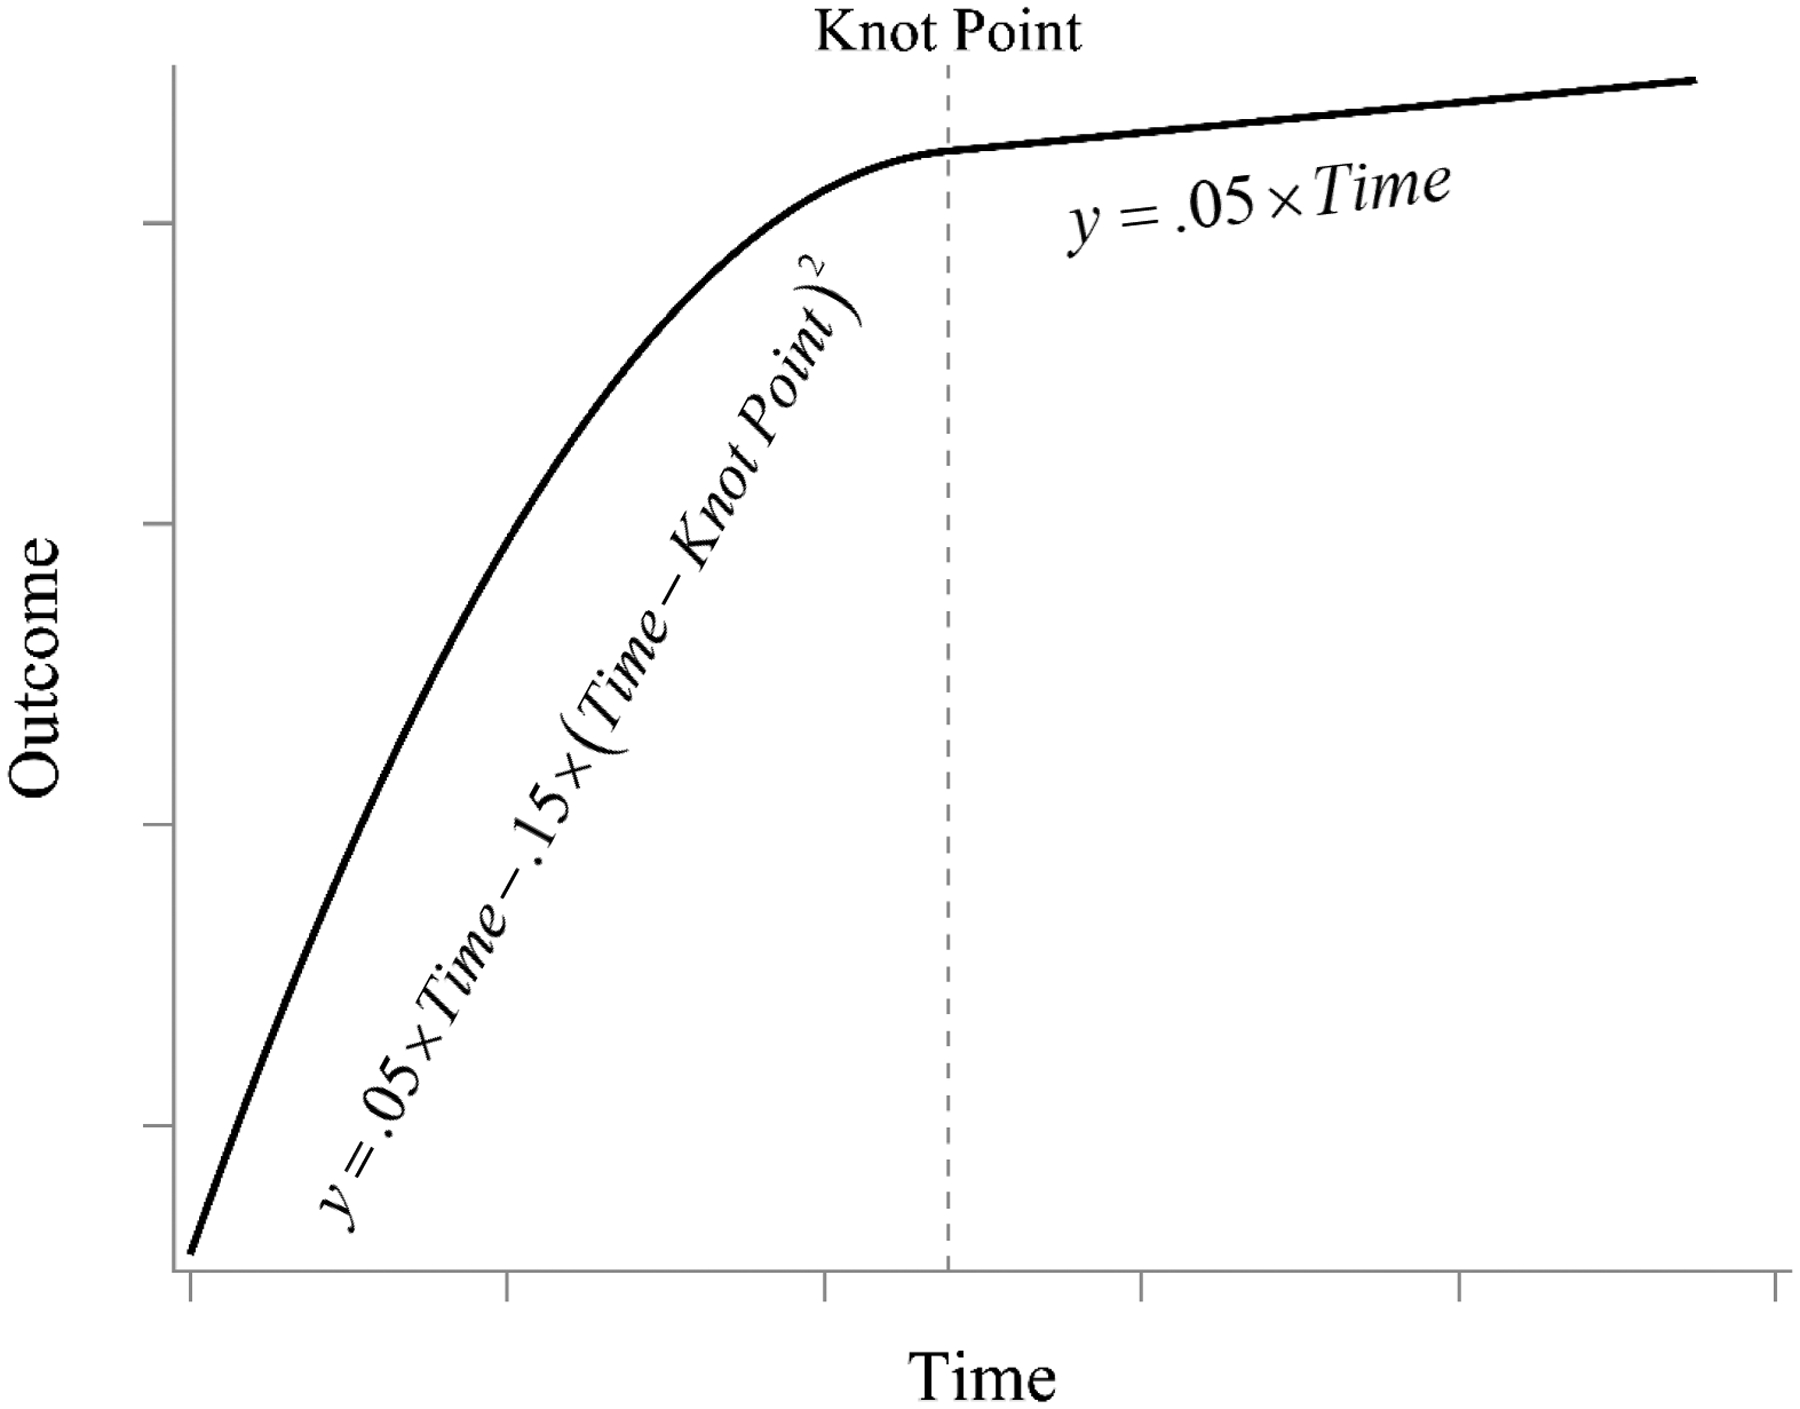
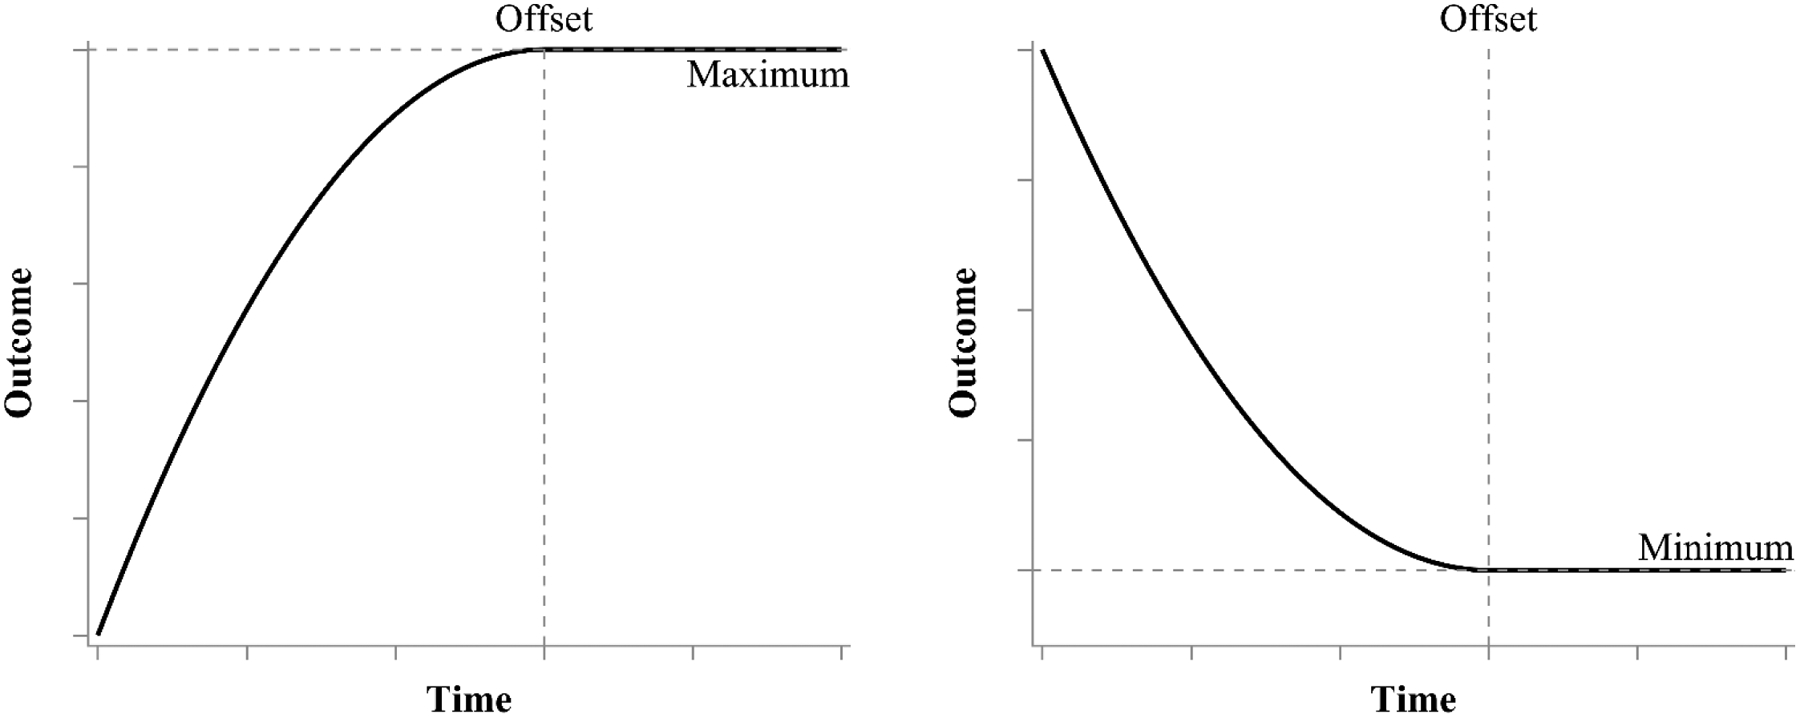
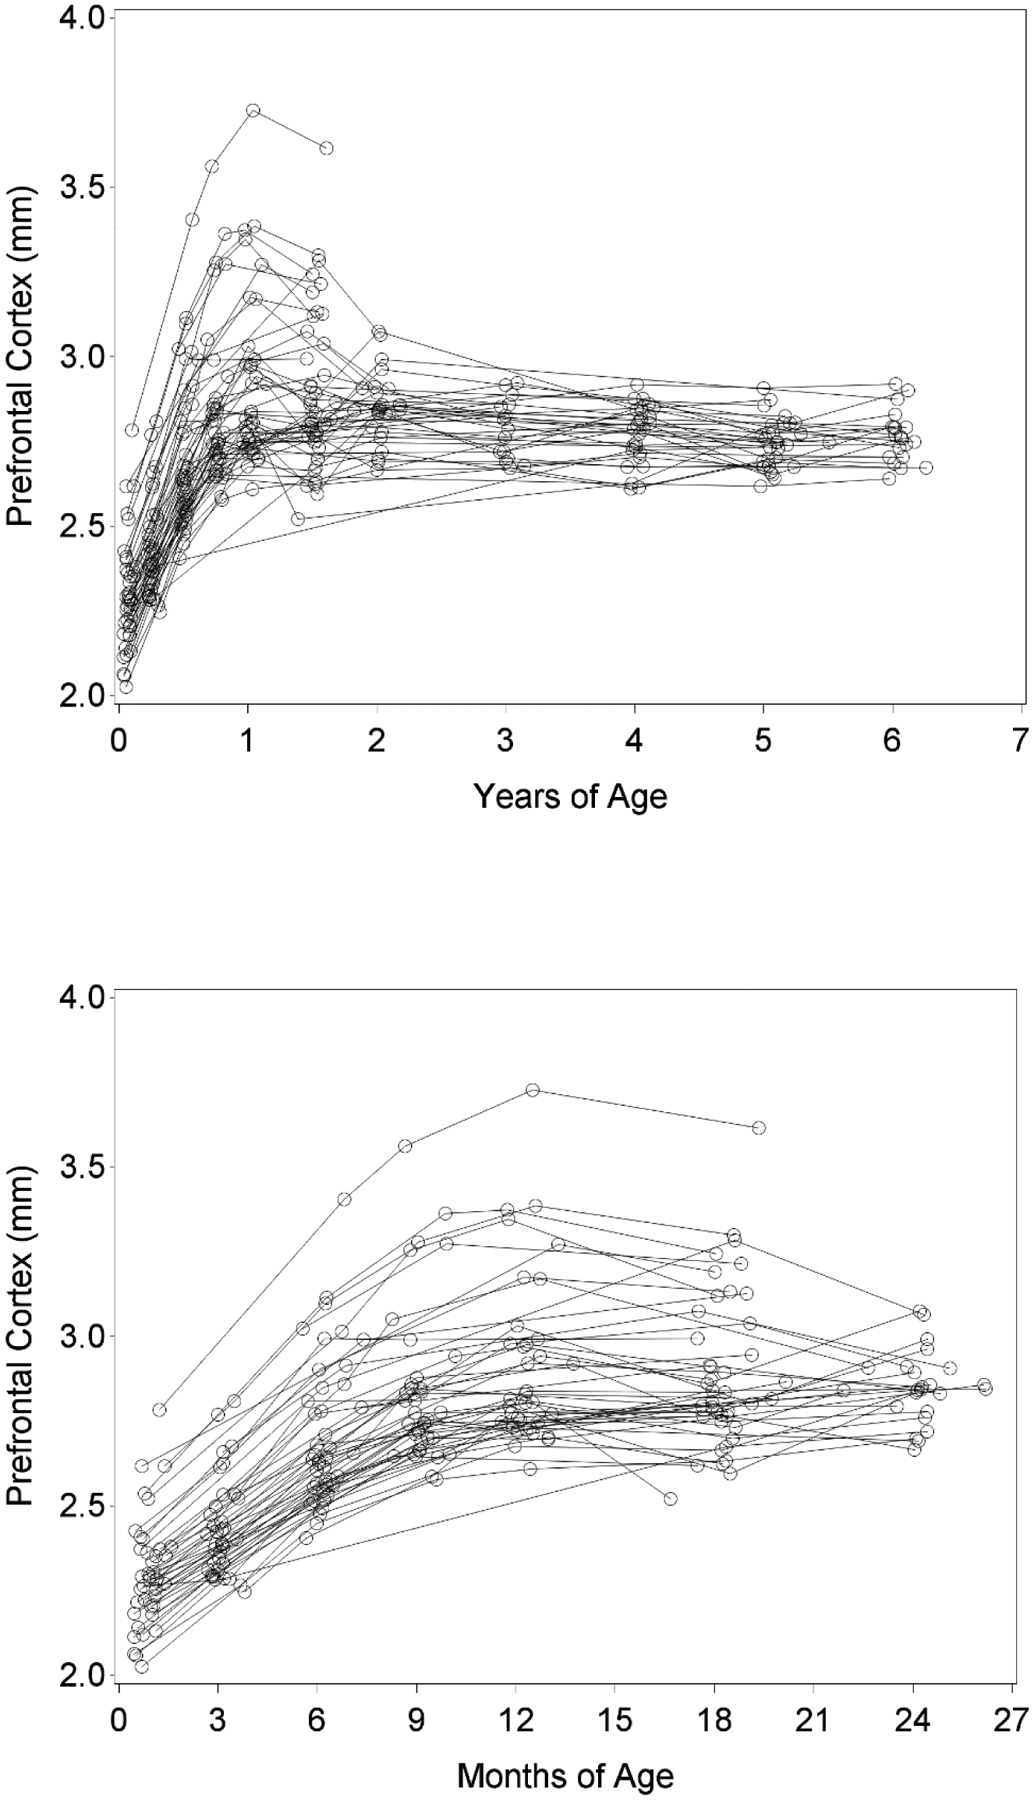
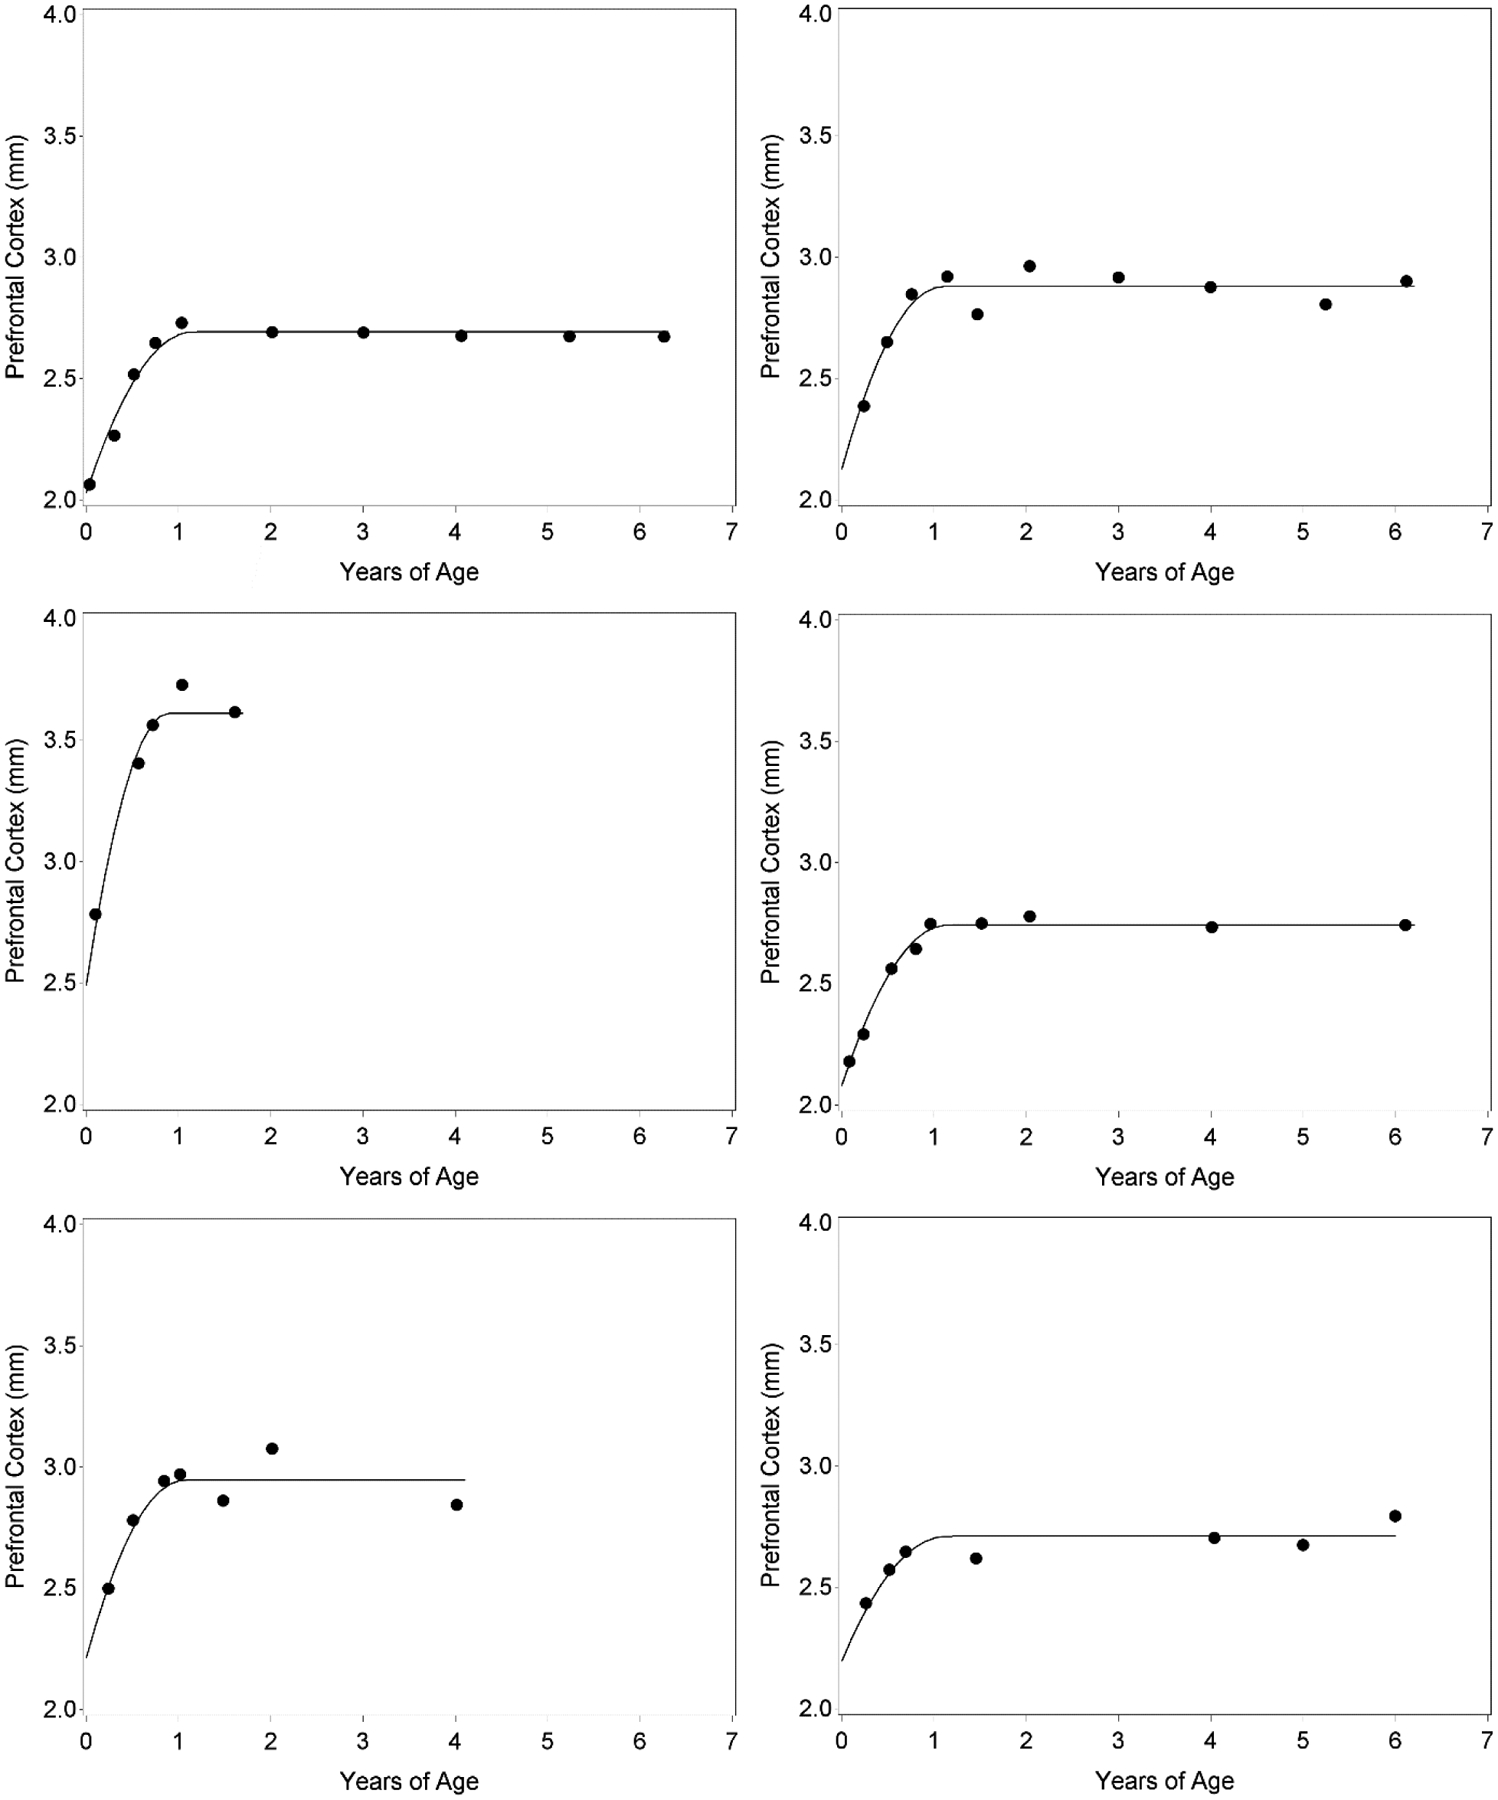
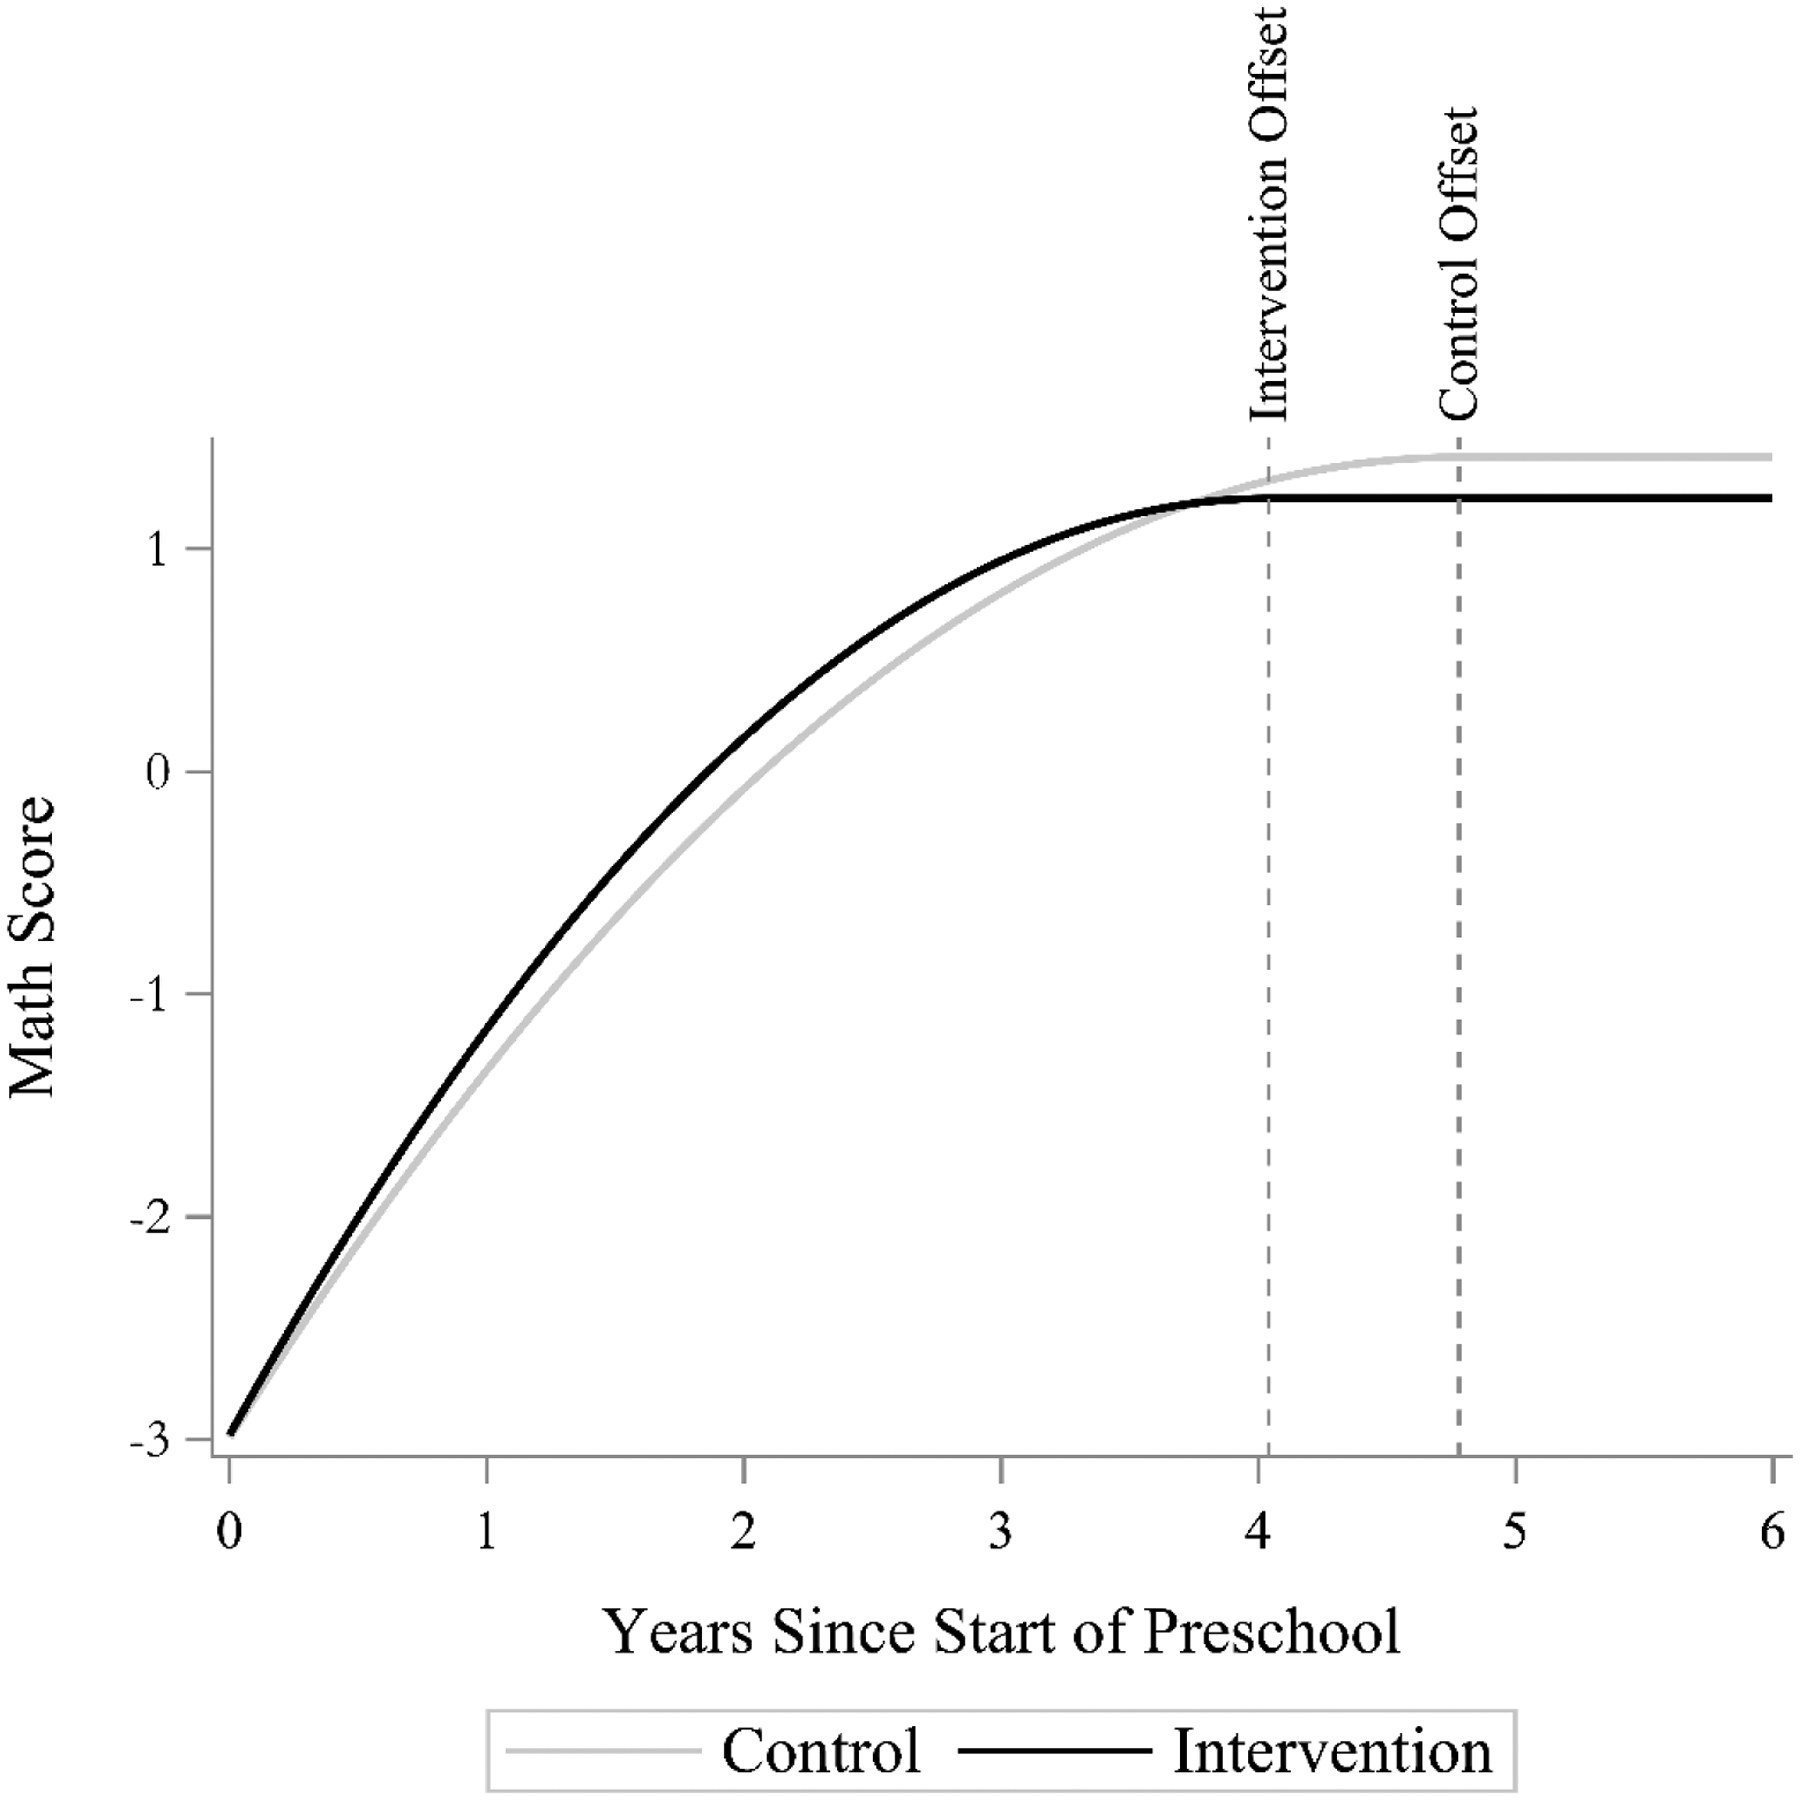
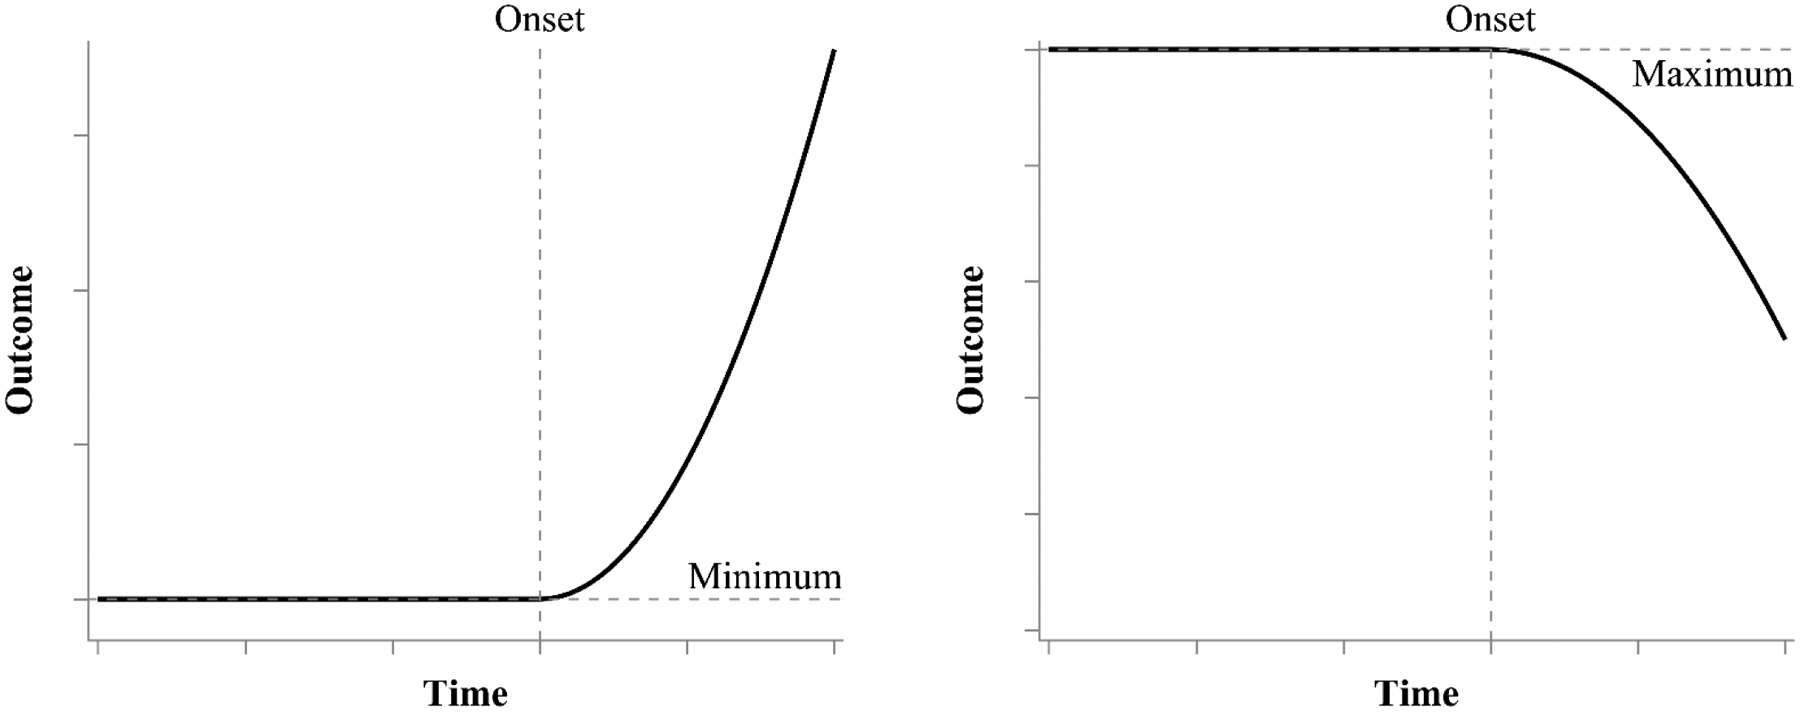
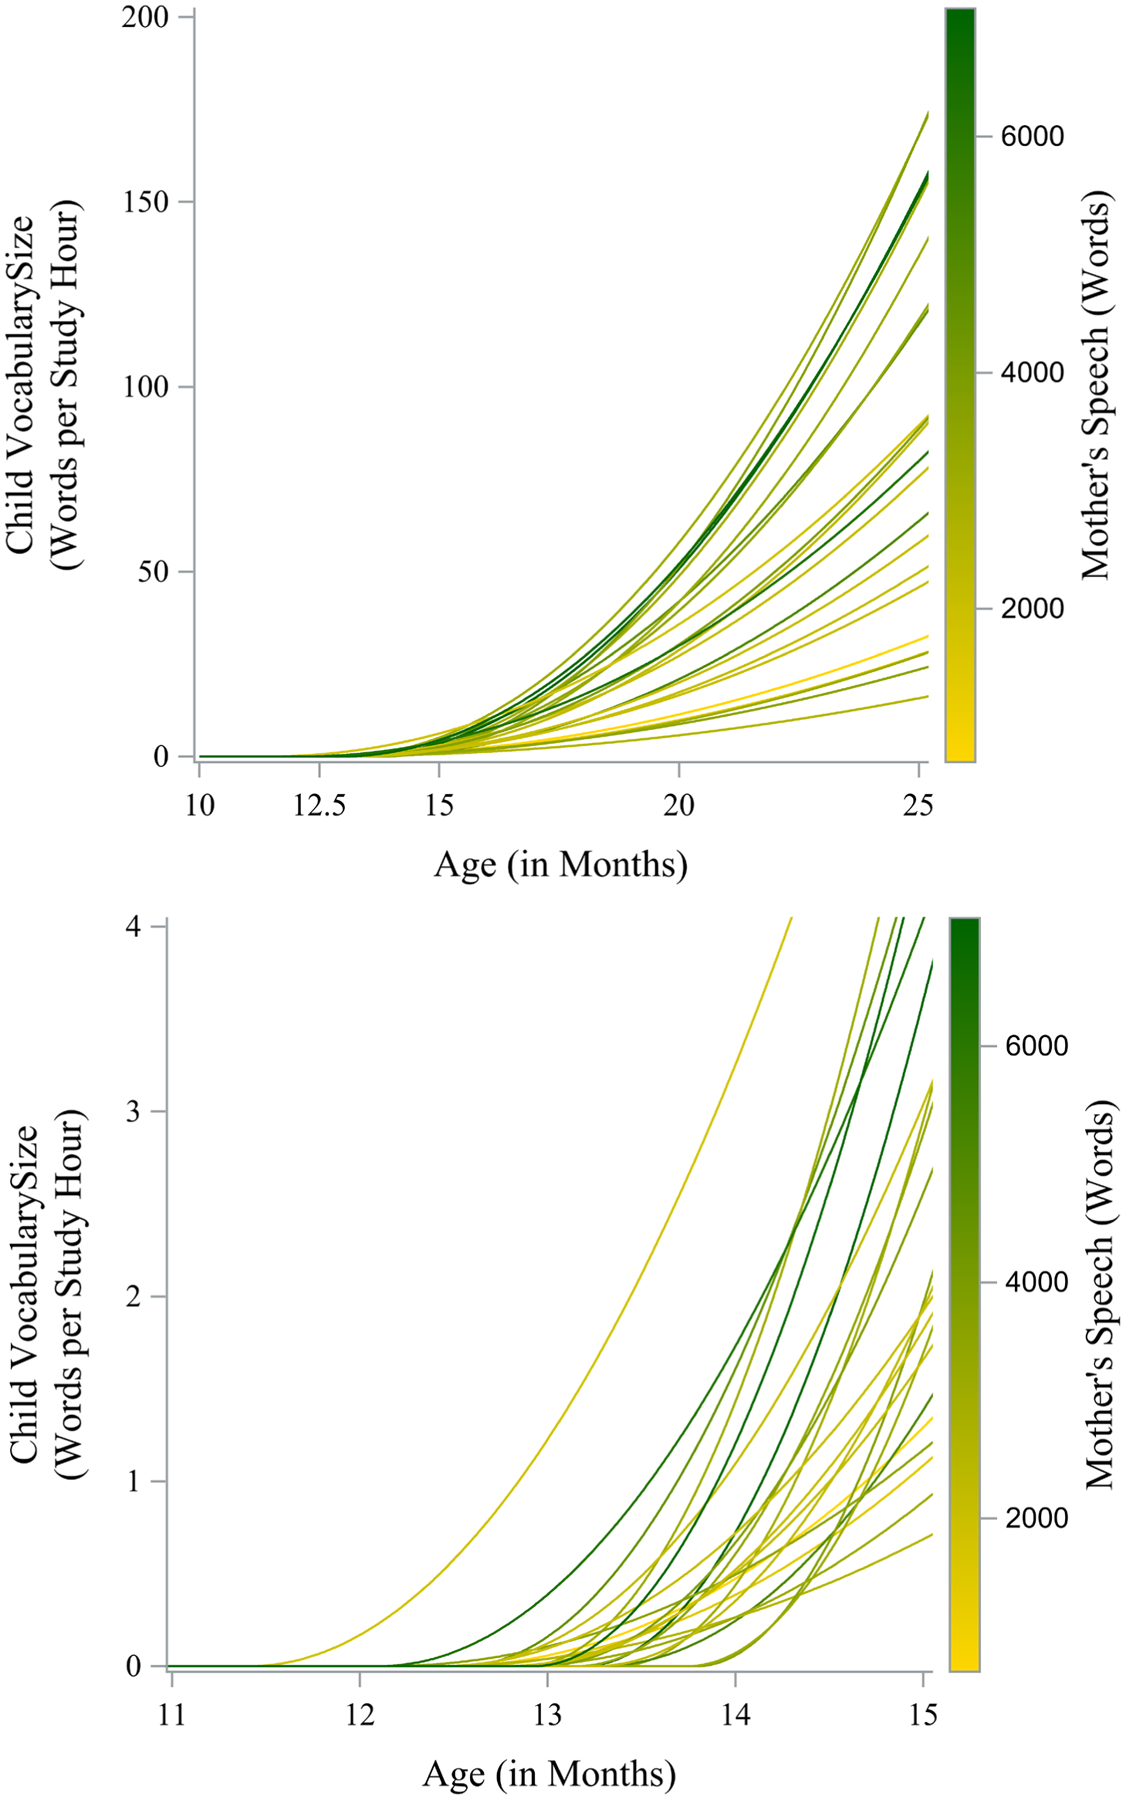
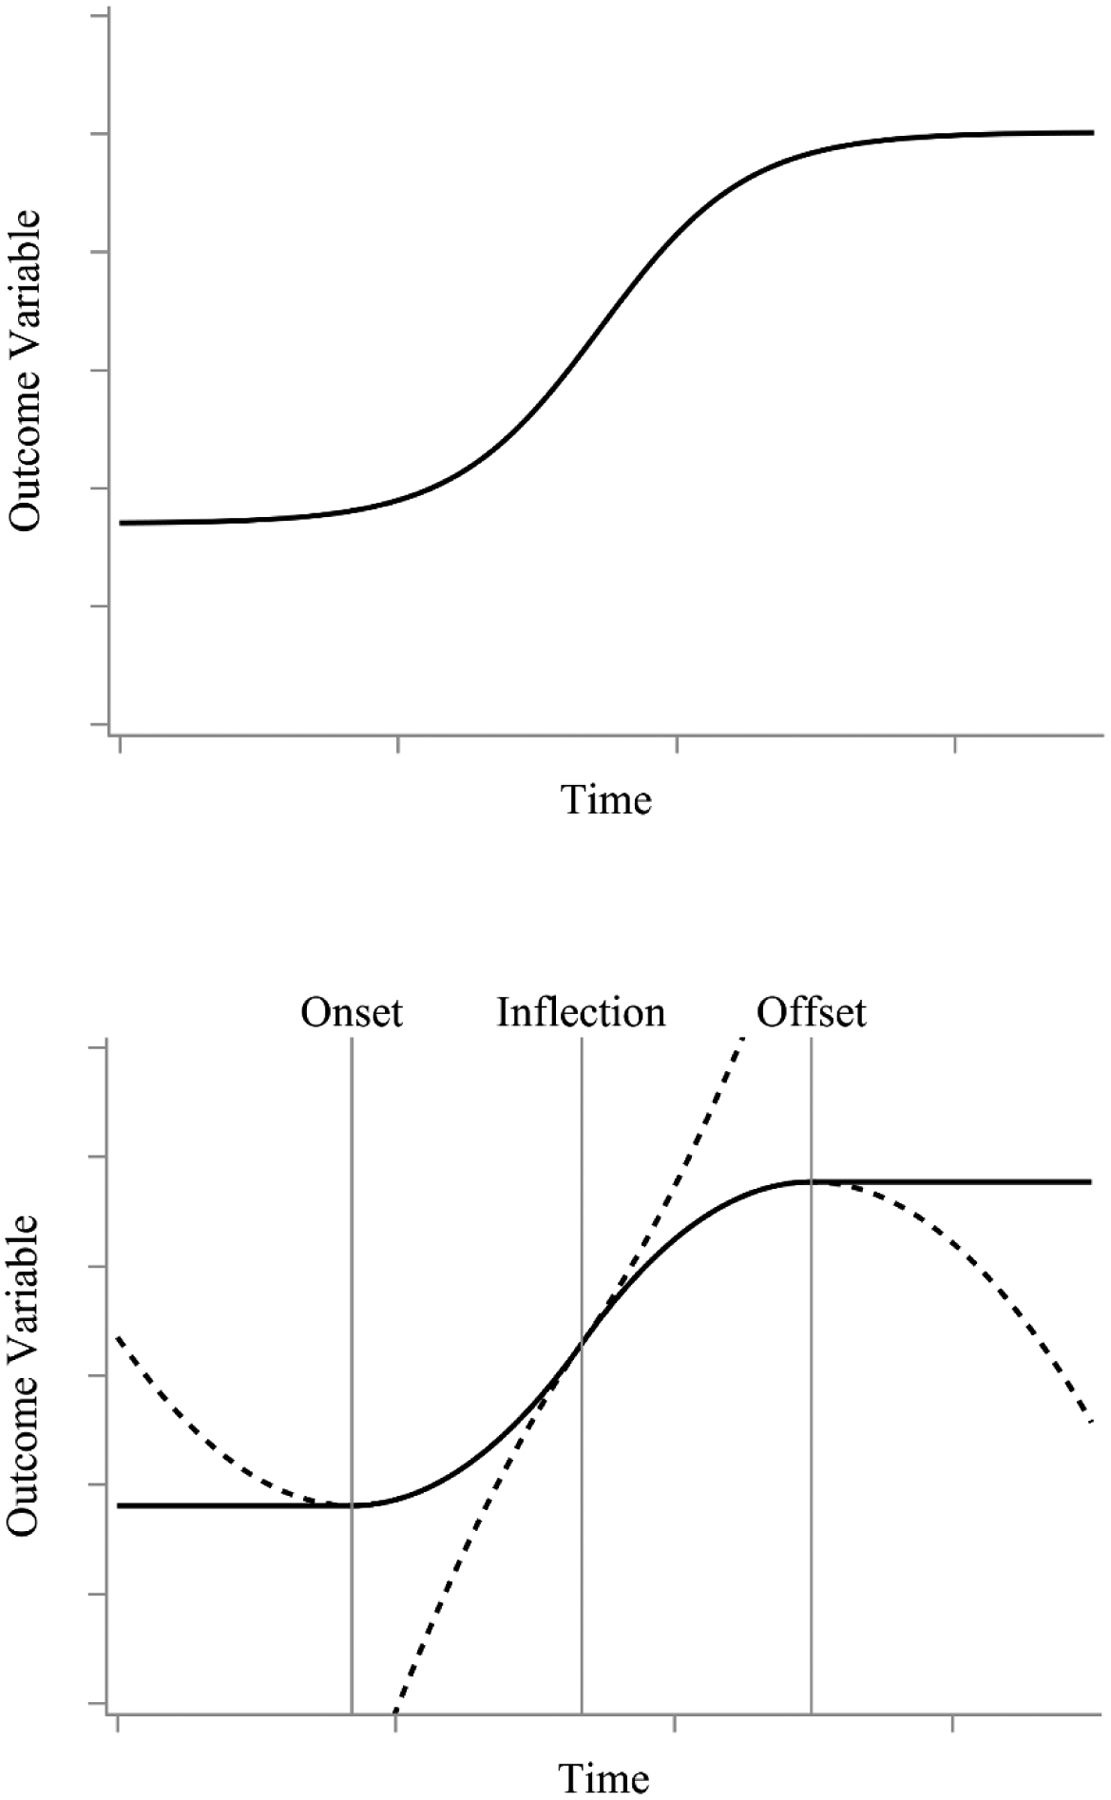
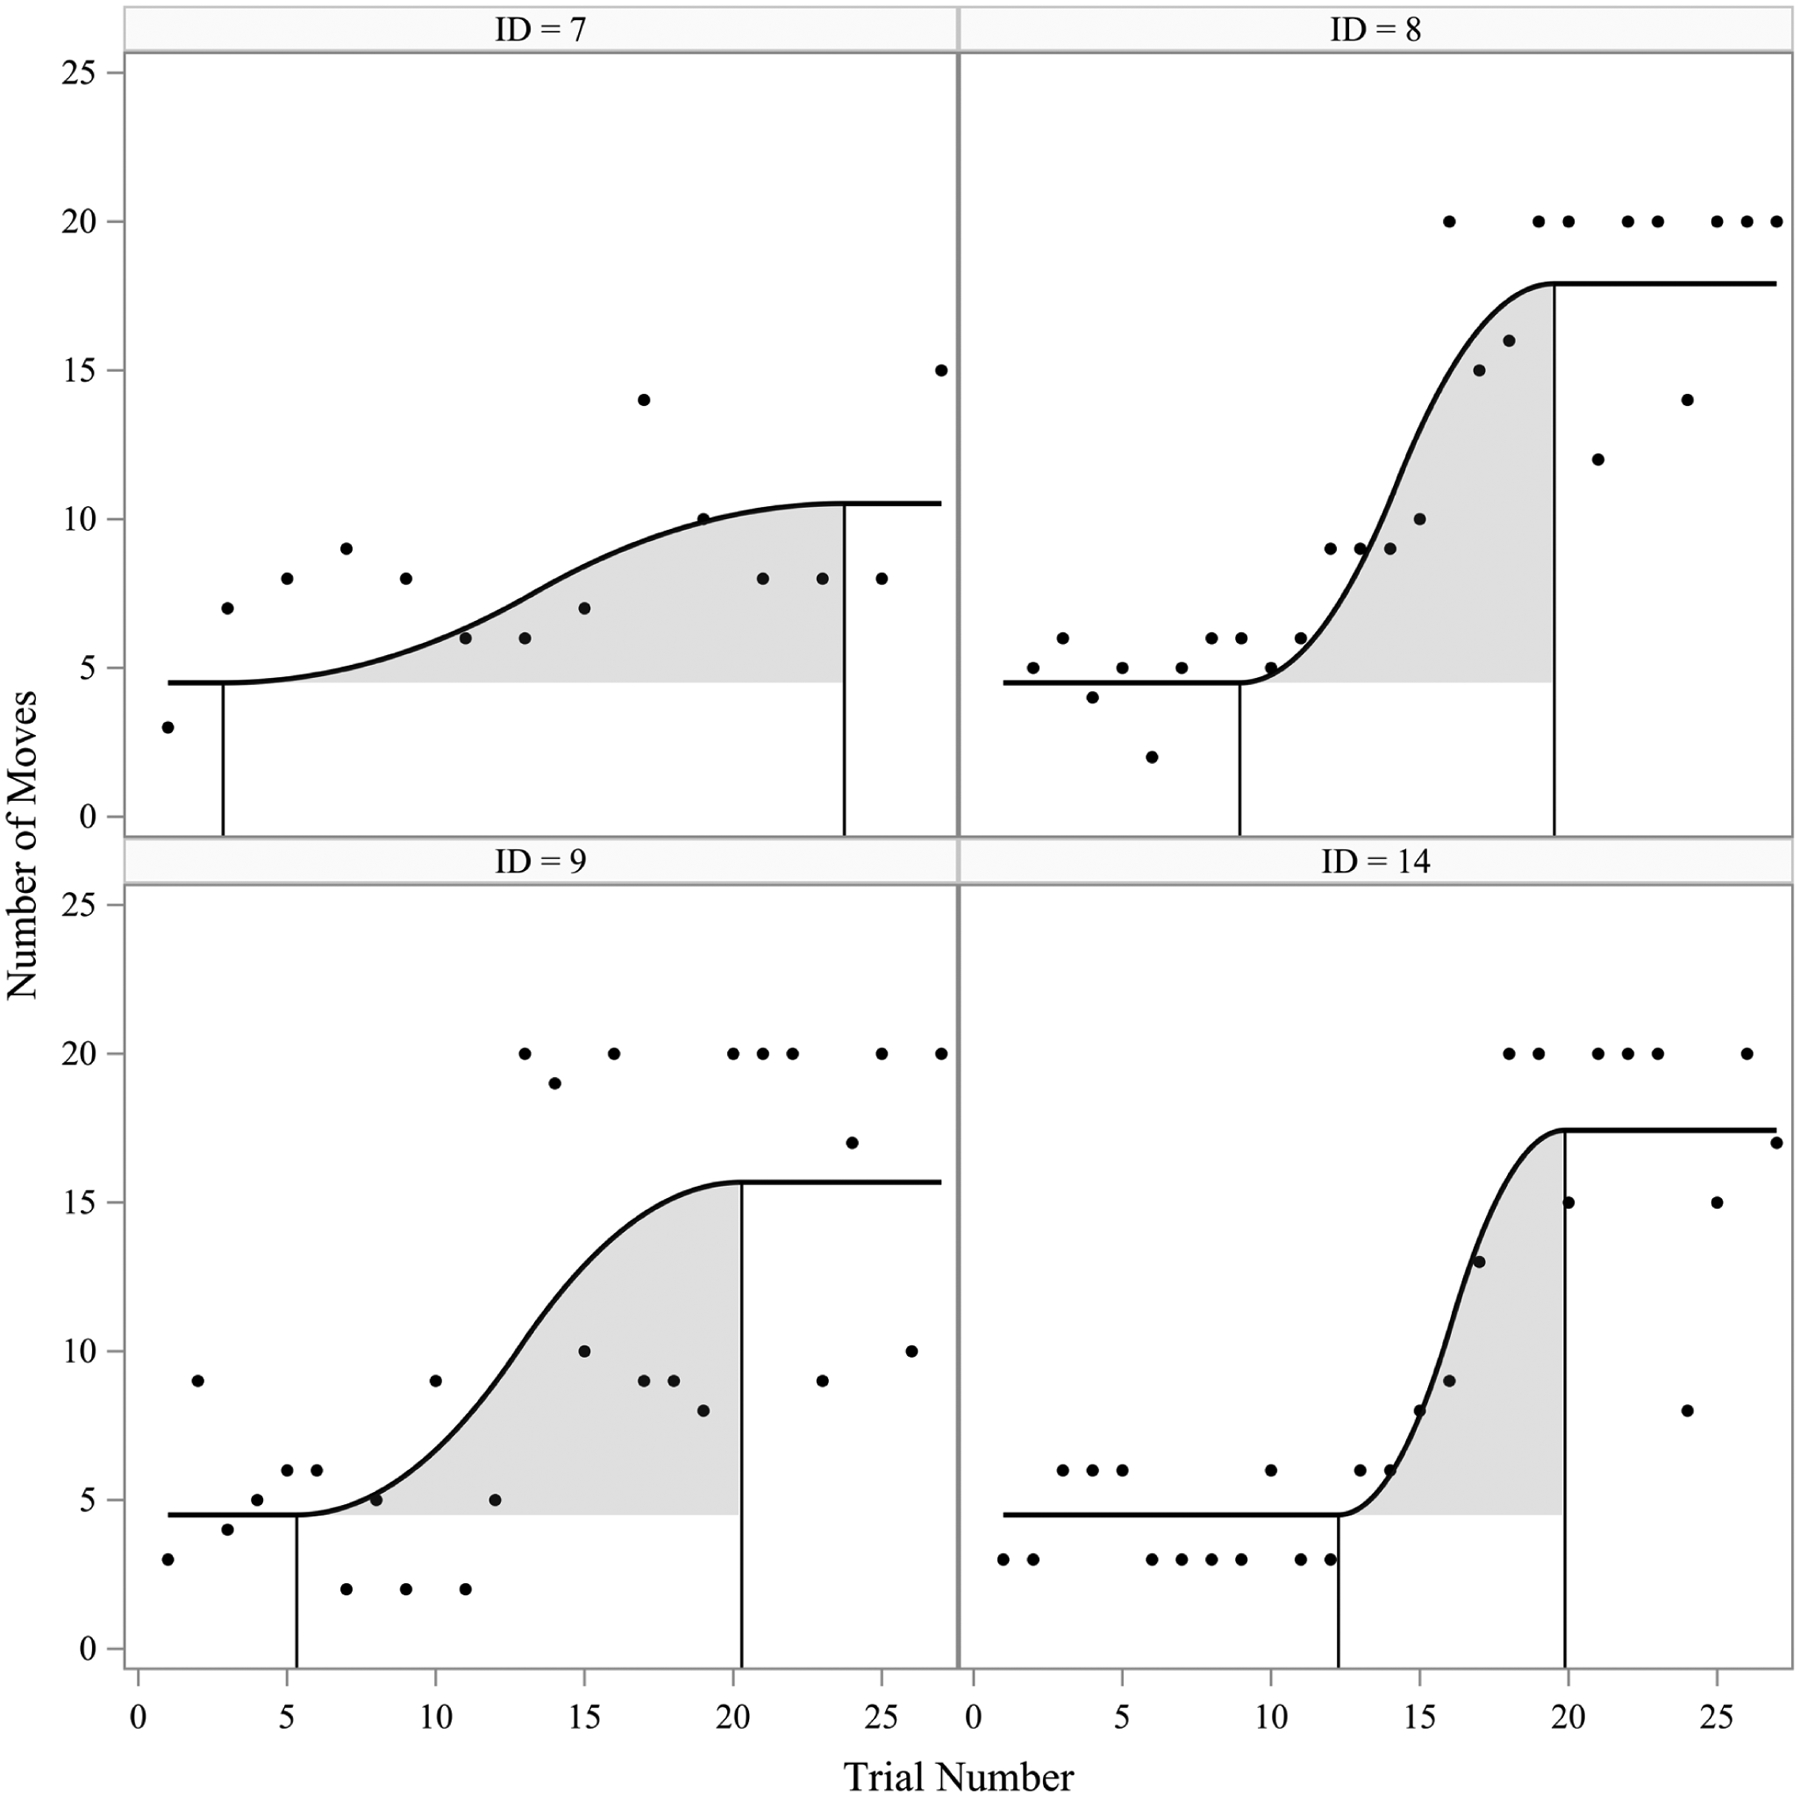
Individual differences in the timing of developmental processes are often of interest in longitudinal studies, yet common statistical approaches to modeling change cannot directly estimate the timing of when change occurs. The time-to-criterion framework was recently developed to incorporate the timing of a prespecified criterion value; however, this framework has difficulty accommodating contexts where the criterion value differs across people or when the criterion value is not known a priori, such as when the interest is in individual differences in when change starts or stops. This article combines aspects of reparameterized quadratic models and multiphase models to provide information on the timing of change. We first consider the more common situation of modeling decelerating change to an offset point, defined as the point in time at which change ceases. For increasing trajectories, the offset occurs when the criterion attains its maximum ("inverted J-shaped" trajectories). For decreasing trajectories, offset instead occurs at the minimum. Our model allows for individual differences in both the timing of offset and ultimate level of the outcome. The same model, reparameterized slightly, captures accelerating change from a point of onset ("J-shaped" trajectories). We then extend the framework to accommodate "S-shaped" curves where both the onset and offset of change are within the observation window. We provide demonstrations that span neuroscience, educational psychology, developmental psychology, and cognitive science, illustrating the applicability of the modeling framework to a variety of research questions about individual differences in the timing of change. (PsycInfo Database Record (c) 2023 APA, all rights reserved).


Figures

Figure 1.
Figure 1.
Visual representation of Cudeck and du Toit (2002) model. The model has three parameters to explicitly estimate the intercept (not labeled), the maximum value, and the timing of the maximum value.
Figure 2.
Figure 2.
Visual representation of hypothetical two-phase quadratic-linear model from Cudeck and Klebe (2002) with equality of first derivatives across phases. The model changes function form at the knot point, but the equality of the first derivatives leads to a smooth transition between the phases.
Figure 3.
Figure 3.
Hypothetical plot of a time-at-offset process growing towards a maximum value (left) and a time-at-offset process decaying towards a minimum value (right). Prior to the change offset, the growth trajectory follows a quadratic function. Once reaching the change offset, which is defined as the extremum of the quadratic function, the growth trajectory becomes a horizontal line at the maximum or minimum value of the quadratic function.
Figure 4.
Figure 4.
Top panel displays observed values for repeated measures of thickness of the prefrontal cortex over the entire span of the study (age scaled in years). The bottom panel considers only observations within approximately the first two years (age scaled in months) to magnify the rapidly decelerating changes occurring within this period.
Figure 5.
Figure 5.
Observed repeated measures (circles) and implied trajectories for six representative children.
Figure 6.
Figure 6.
Comparison of the Intervention and Control group for the Building Blocks data. The intercepts and maximum values are not different across groups, but the offset of the intervention occurs 9 months before the offset of the control group.
Figure 7.
Figure 7.
Hypothetical plot of a time-at-onset process that maintains a minimum value until the change onset and grows quadratically thereafter (left) and a time-at-onset process that maintains a maximum until the change onset and decays thereafter (right). Prior to the change onset, the growth trajectory follows a horizontal line at the maximum or minimum value. Once reaching the change onset, the growth trajectory follows a quadratic function.
Figure 8.
Figure 8.
Gradient plot for person-specific model-implied trajectories with color determined by Mother’s Vocabulary across the entire observation window (top panel) and a detail of the change onsets (bottom panel).
Figure 9.
Figure 9.
A representative sigmoidal curve (top) and graphical depiction of how sigmoidal curves can be split into two horizontal lines (one before the change onset and one after the change offset) and two quadratic curves represented by dotted lines (one convex and one concave) that intersect at the inflection point. The multiphase double quadratic model breaks a sigmoidal curve into 4 phases (pre-onset, onset to inflection, inflection to offset, post-offset) to incorporate individually varying change onsets and change offsets
Figure 10.
Figure 10.
Observed repeated measures (circles) and model-implied trajectories (solid black line) for four children. Solid vertical black lines represent the individual timing of the change onset and change offsets and grey shading represents the refinement period for each child.

References

    1. Ahmed W, van der Werf G, Kuyper H, & Minnaert A (2013). Emotions, self-regulated learning, and achievement in mathematics: A growth curve analysis. Journal of Educational Psychology, 105, 150–161. 10.1037/a0030160 - DOI
    1. Bailey DH, Duncan GJ, Watts T, Clements DH, & Sarama J (2018). Risky business: Correlation and causation in longitudinal studies of skill development. American Psychologist, 73, 81–94. 10.1037/amp0000146 - DOI - PMC - PubMed
    1. Bauer DJ, Goldfield BA, & Reznick JS (2002). Alternative approaches to analyzing individual differences in the rate of early vocabulary development. Applied Psycholinguistics, 23, 313–335. DOI 10.1017.S014271640200301
    1. Becker M, & Neumann M (2018). Longitudinal big-fish-little-pond effects on academic self-concept development during the transition from elementary to secondary schooling. Journal of Educational Psychology, 110, 882–897. 10.1037/edu0000233 - DOI
    1. Berkhof J, & Snijders TA (2001). Variance component testing in multilevel models. Journal of Educational and Behavioral Statistics, 26(2), 133–152.