. 2022 Feb;136(1):46-60.
doi: 10.1037/bne0000492. Epub 2021 Sep 27.

Reinforcement learning modeling reveals a reward-history-dependent strategy underlying reversal learning in squirrel monkeys

Affiliations

Reinforcement learning modeling reveals a reward-history-dependent strategy underlying reversal learning in squirrel monkeys

Bilal A Bari et al. Behav Neurosci. 2022 Feb.

Abstract

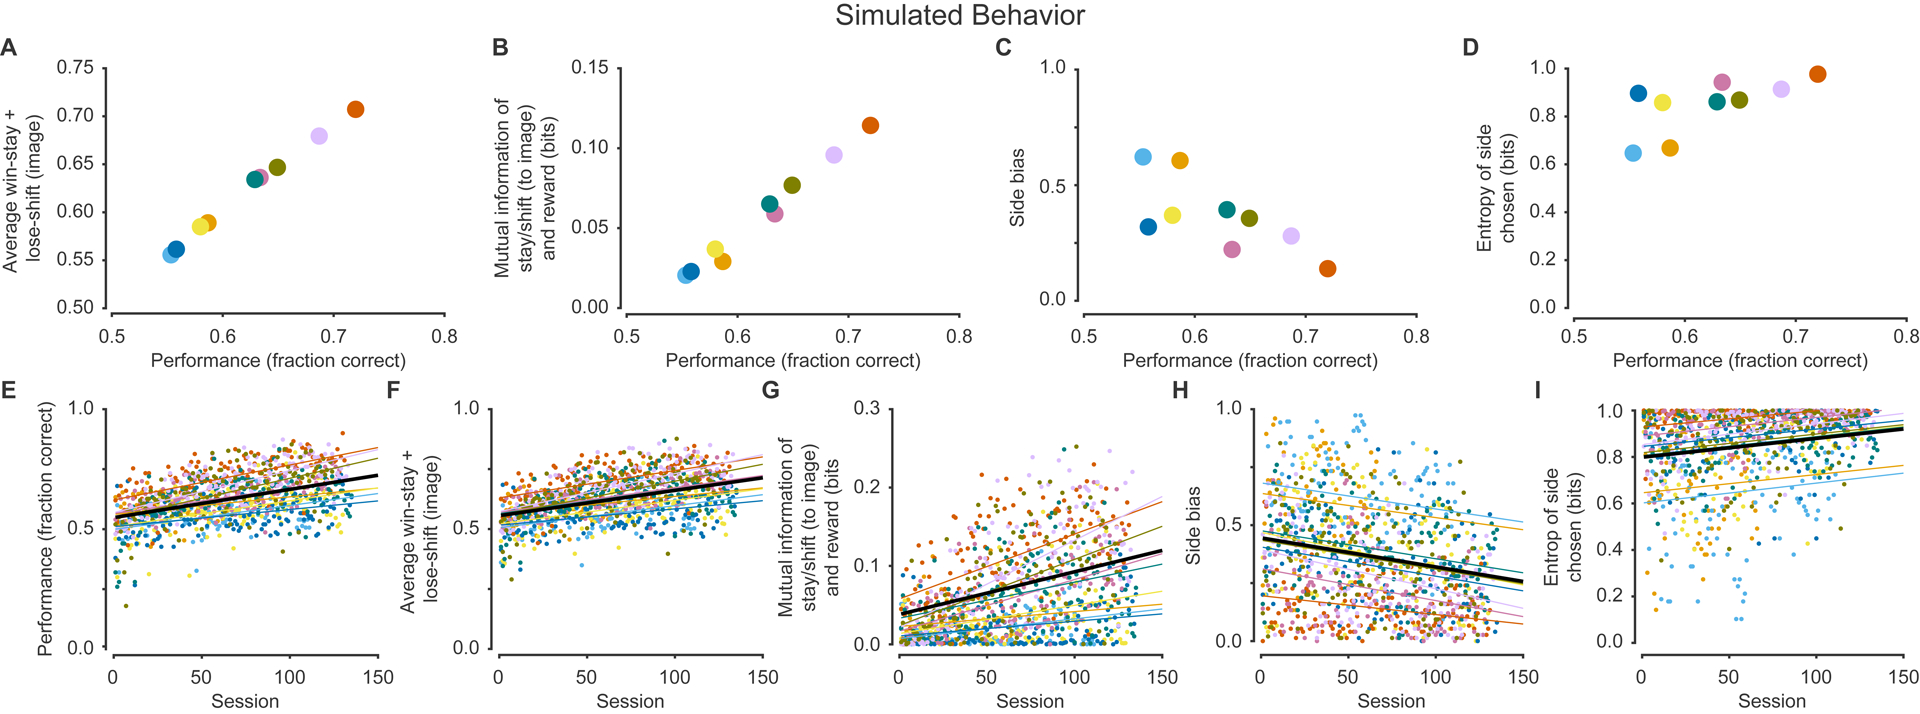
Insight into psychiatric disease and development of therapeutics relies on behavioral tasks that study similar cognitive constructs in multiple species. The reversal learning task is one popular paradigm that probes flexible behavior, aberrations of which are thought to be important in a number of disease states. Despite widespread use, there is a need for a high-throughput primate model that can bridge the genetic, anatomic, and behavioral gap between rodents and humans. Here, we trained squirrel monkeys, a promising preclinical model, on an image-guided deterministic reversal learning task. We found that squirrel monkeys exhibited two key hallmarks of behavior found in other species: integration of reward history over many trials and a side-specific bias. We adapted a reinforcement learning model and demonstrated that it could simulate squirrel monkey-like behavior, capture training-related trajectories, and provide insight into the strategies animals employed. These results validate squirrel monkeys as a model in which to study behavioral flexibility. (PsycInfo Database Record (c) 2022 APA, all rights reserved).


Conflict of interest statement

Conflict of Interest: None

Figures

Figure 1:
Figure 1:. Reversal learning task design.
(A) Squirrel monkeys chose between two images presented on the left and right halves of a touchscreen. A choice was registered by physically touching either visual stimulus on the display. One image was deterministically associated with big milk reward, and the other image was associated with small milk reward. Image locations were randomly displayed on the left and right halves of the screen on separate trials. (B) Monkeys performed sequences of Discrimination and Reversal blocks. At the beginning of each Discrimination block, two new images were randomly sampled from a large library of images and each image was randomly assigned to big or small reward. At the beginning of each Reversal block, the two images switched reward contingencies. Block transitions were triggered by a threshold of 80% correct responses (response to the big reward image) in the past 15 trials, after a minimum of 20 trials. These transitions were unsignaled, requiring the animal to use reward feedback to guide decisions. (C) Example choice behavior demonstrates the flexibility of behavior at Discrimination → Reversal and Reversal → Discrimination block transitions.
Figure 2:
Figure 2:. Behavioral features demonstrate reward sensitivity and side bias
(A) Performance was significantly better than chance (50%, dashed line). (B) Logistic regression coefficients for choice as a function of reward history and side history. (C) Performance at block transitions for all blocks, and separately for Discrimination and Reversal blocks. Relative to Reversal blocks, monkeys were faster to improve performance during new Discrimination blocks. The increase in performance prior to block transitions is because transitions were triggered by good performance. (D) Performance was better in Discrimination blocks relative to Reversal blocks. (E) Image-based win-stay and lose-shift were both greater than 0:5, demonstrating that animals learned from both wins (big reward) and losses (small reward) to guide decisions. (F) The average win-stay + lose-shift, which can be taken as a proxy for the strength of reward-guided behavior, was greater than 0:5 (dashed line). Values close to 0:5 are consistent with reward-insensitive behavior and values of 1:0 are consistent with a perfect win-stay lose-shift strategy. (G) The mutual information between stay/switch and reward on the previous trial. Mutual information quantifies how much better we can predict the strategy (stay vs switch) if we know the reward received on the previous trial (dashed line is from simulated random behavior). (H) Side-based win-stay and lose-shift highlight a side bias, where animals largely stay. (I) Side bias, which is 1 if choices are exclusively to one side and 0 if they are uniformly split, was widely distributed (dashed line is from simulated non-side-biased behavior). Colors denote individual monkeys and are consistent between figures. In panels A, E-I, each data point is the average for one monkey, across all sessions and blocks. Panels B-D are analysis of all the data, pooled across all monkeys, sessions, and blocks.
Figure 3:
Figure 3:. Relationship between performance, reward sensitivity, side bias, and training
(A) The average win-stay + lose-shift increased with increased performance. (B) The mutual information between stay/shift and reward increased with performance > 0:5. (C) Side bias was higher when performance was closer to 0:5 and reduced when performance was better. (D) Performance improved with more sessions performed. (E) The average win-stay + lose-shift improved with training. (F) The mutual information between stay/switch and reward increased with training. (G) Side bias decreased with training. Black line shows the fixed effect and thin colored lines show individual monkey random effects. Colors denote individual monkeys and are consistent between figures. In panels A-C, each dot is the average for one monkey, across all sessions and blocks. In panels D-G, each dot is the average for one session, across all blocks.
Figure 4:
Figure 4:. Simulated behavioral features demonstrate squirrel monkey-like reward sensitivity and side bias
(A) Distribution of performance was better than chance. (B) Logistic regression coefficients for choice as a function of reward history and side history shows dependence for many trials in the past. (C) Performance at block transitions for all blocks, and separately for Discrimination and Reversal blocks. Like actual performance, pre-transition simulated data had no significant effect of Block Type which became significant after the transition. (D) Simulated performance was better in Discrimination blocks relative to Reversal blocks. (E) Image-based win-stay and lose-shift were both greater than 0:5. (F) The average win-stay + lose-shift was greater than 0:5. (G) The mutual information between stay/switch and reward on the previous trial is greater than random behavior. (H) Side-based win-stay and lose-shift demonstrates a side bias. (I) Side bias distribution. In panels A, E-I, each data point is the average for one monkey, across all sessions and blocks. Panels B-D are analysis of all the data, pooled across all monkeys, sessions, and blocks.
Figure 5:
Figure 5:. Simulations show similar relationships between simulated performance, reward sensitivity, side bias, and training
(A) Average win-stay + lose-shift showed a positive relationship with performance. (B) Mutual information between stay/shift and reward as a function of performance. (C) Side bias as a function of performance. (D) Performance improved with training. (E) Average win-stay + lose-shift improved with training. (F) Mutual information between stay/switch and reward increased with training. (G) Side bias decreased with training. Black line shows the fixed effect and thin colored lines show individual monkey random effects. Colors depict individual monkeys and are consistent across figures. In panels A-C, each dot is the average for one monkey, across all sessions and blocks. In panels D-G, each dot is the average for one session, across all blocks.
Figure 6:
Figure 6:. Relationship between model parameters, simulated performance, and training
(A) Estimate learning rates for all monkeys. (B) Estimated inverse temperatures for all monkeys. (C) Estimated side biases for all monkeys. (D) As performance improved, the learning rate increased. (E) Inverse temperature showed no significant linear association with performance. (F) The maximal trial-by-trial change in P(choice), which partially accounts for the interaction of both the learning rate and the inverse temperature, increased as performance improved. (G) The absolute side bias showed no significant relationship with performance. (H) Learning rates improved with training. (I) The inverse temperature did not change throughout training. (J) The maximal trial-by-trial change in P(choice) increased with training. (K) Side bias decreased with training. Black line shows the fixed effect and thin colored lines show individual monkey random effects. Colors denote individual monkeys and are consistent between figures.

References

    1. Abee CR. Squirrel monkey (Saimiri spp.) research and resources. ILAR journal 41: 2–9, 2000. - PubMed
    1. Averbeck BB. Amygdala and ventral striatum population codes implement multiple learning rates for reinforcement learning. In 2017 IEEE Symposium Series on Computational Intelligence (Ssci), pp. 1–5. IEEE, 2017.
    1. Aylward J, Valton V, Ahn WY, Bond RL, Dayan P, Roiser JP, Robinson OJ. Altered learning under uncertainty in unmedicated mood and anxiety disorders. Nature human behaviour 3: 1116–1123, 2019. - PMC - PubMed
    1. Ballard IC, McClure SM. Joint modeling of reaction times and choice improves parameter identifiability in reinforcement learning models. Journal of Neuroscience Methods 317: 37–44, 2019. - PMC - PubMed
    1. Balleine BW, O’Doherty JP. Human and rodent homologies in action control: corticostriatal determinants of goal-directed and habitual action. Neuropsychopharmacology 35: 48–69, 2010. - PMC - PubMed