. 2022 Jan;151(1):41-64.
doi: 10.1037/xge0000910. Epub 2021 Sep 27.

More frequent, shorter trials enhance acquisition in a training session: There is a free lunch!

Affiliations

More frequent, shorter trials enhance acquisition in a training session: There is a free lunch!

Robin A Murphy et al. J Exp Psychol Gen. 2022 Jan.

Abstract

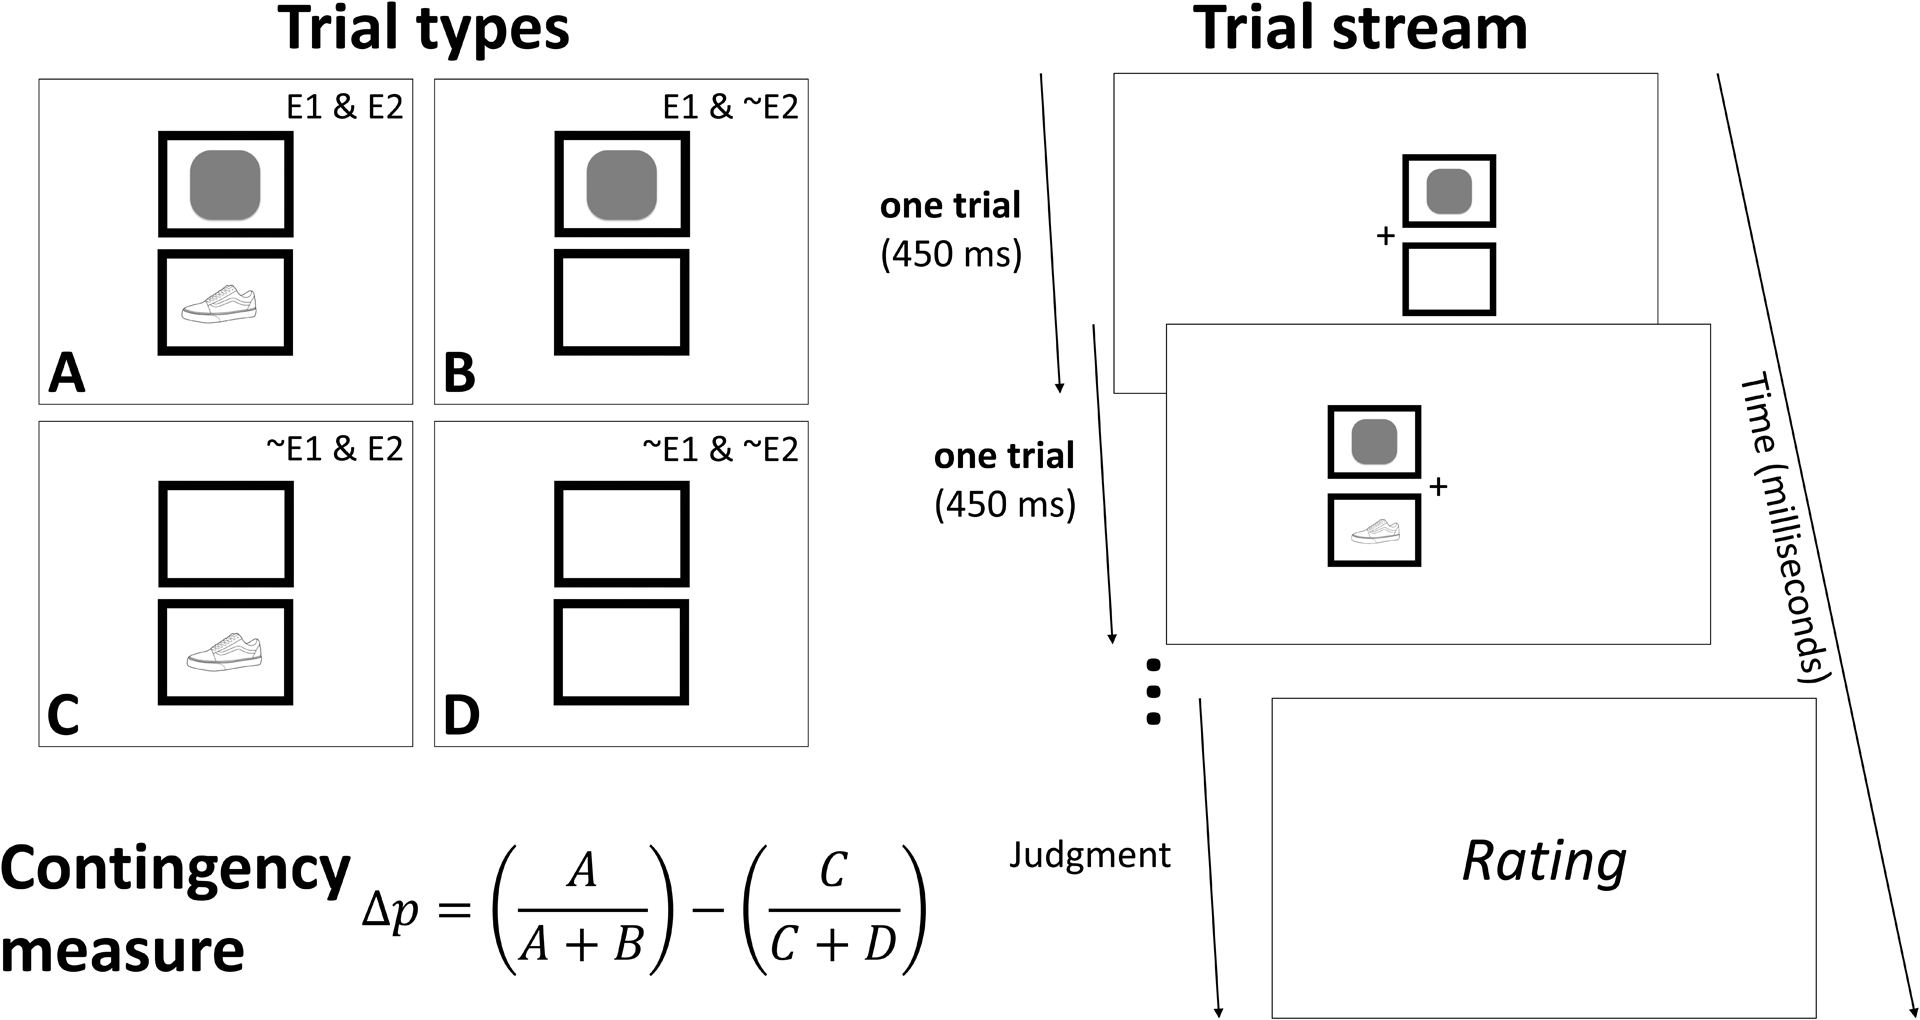
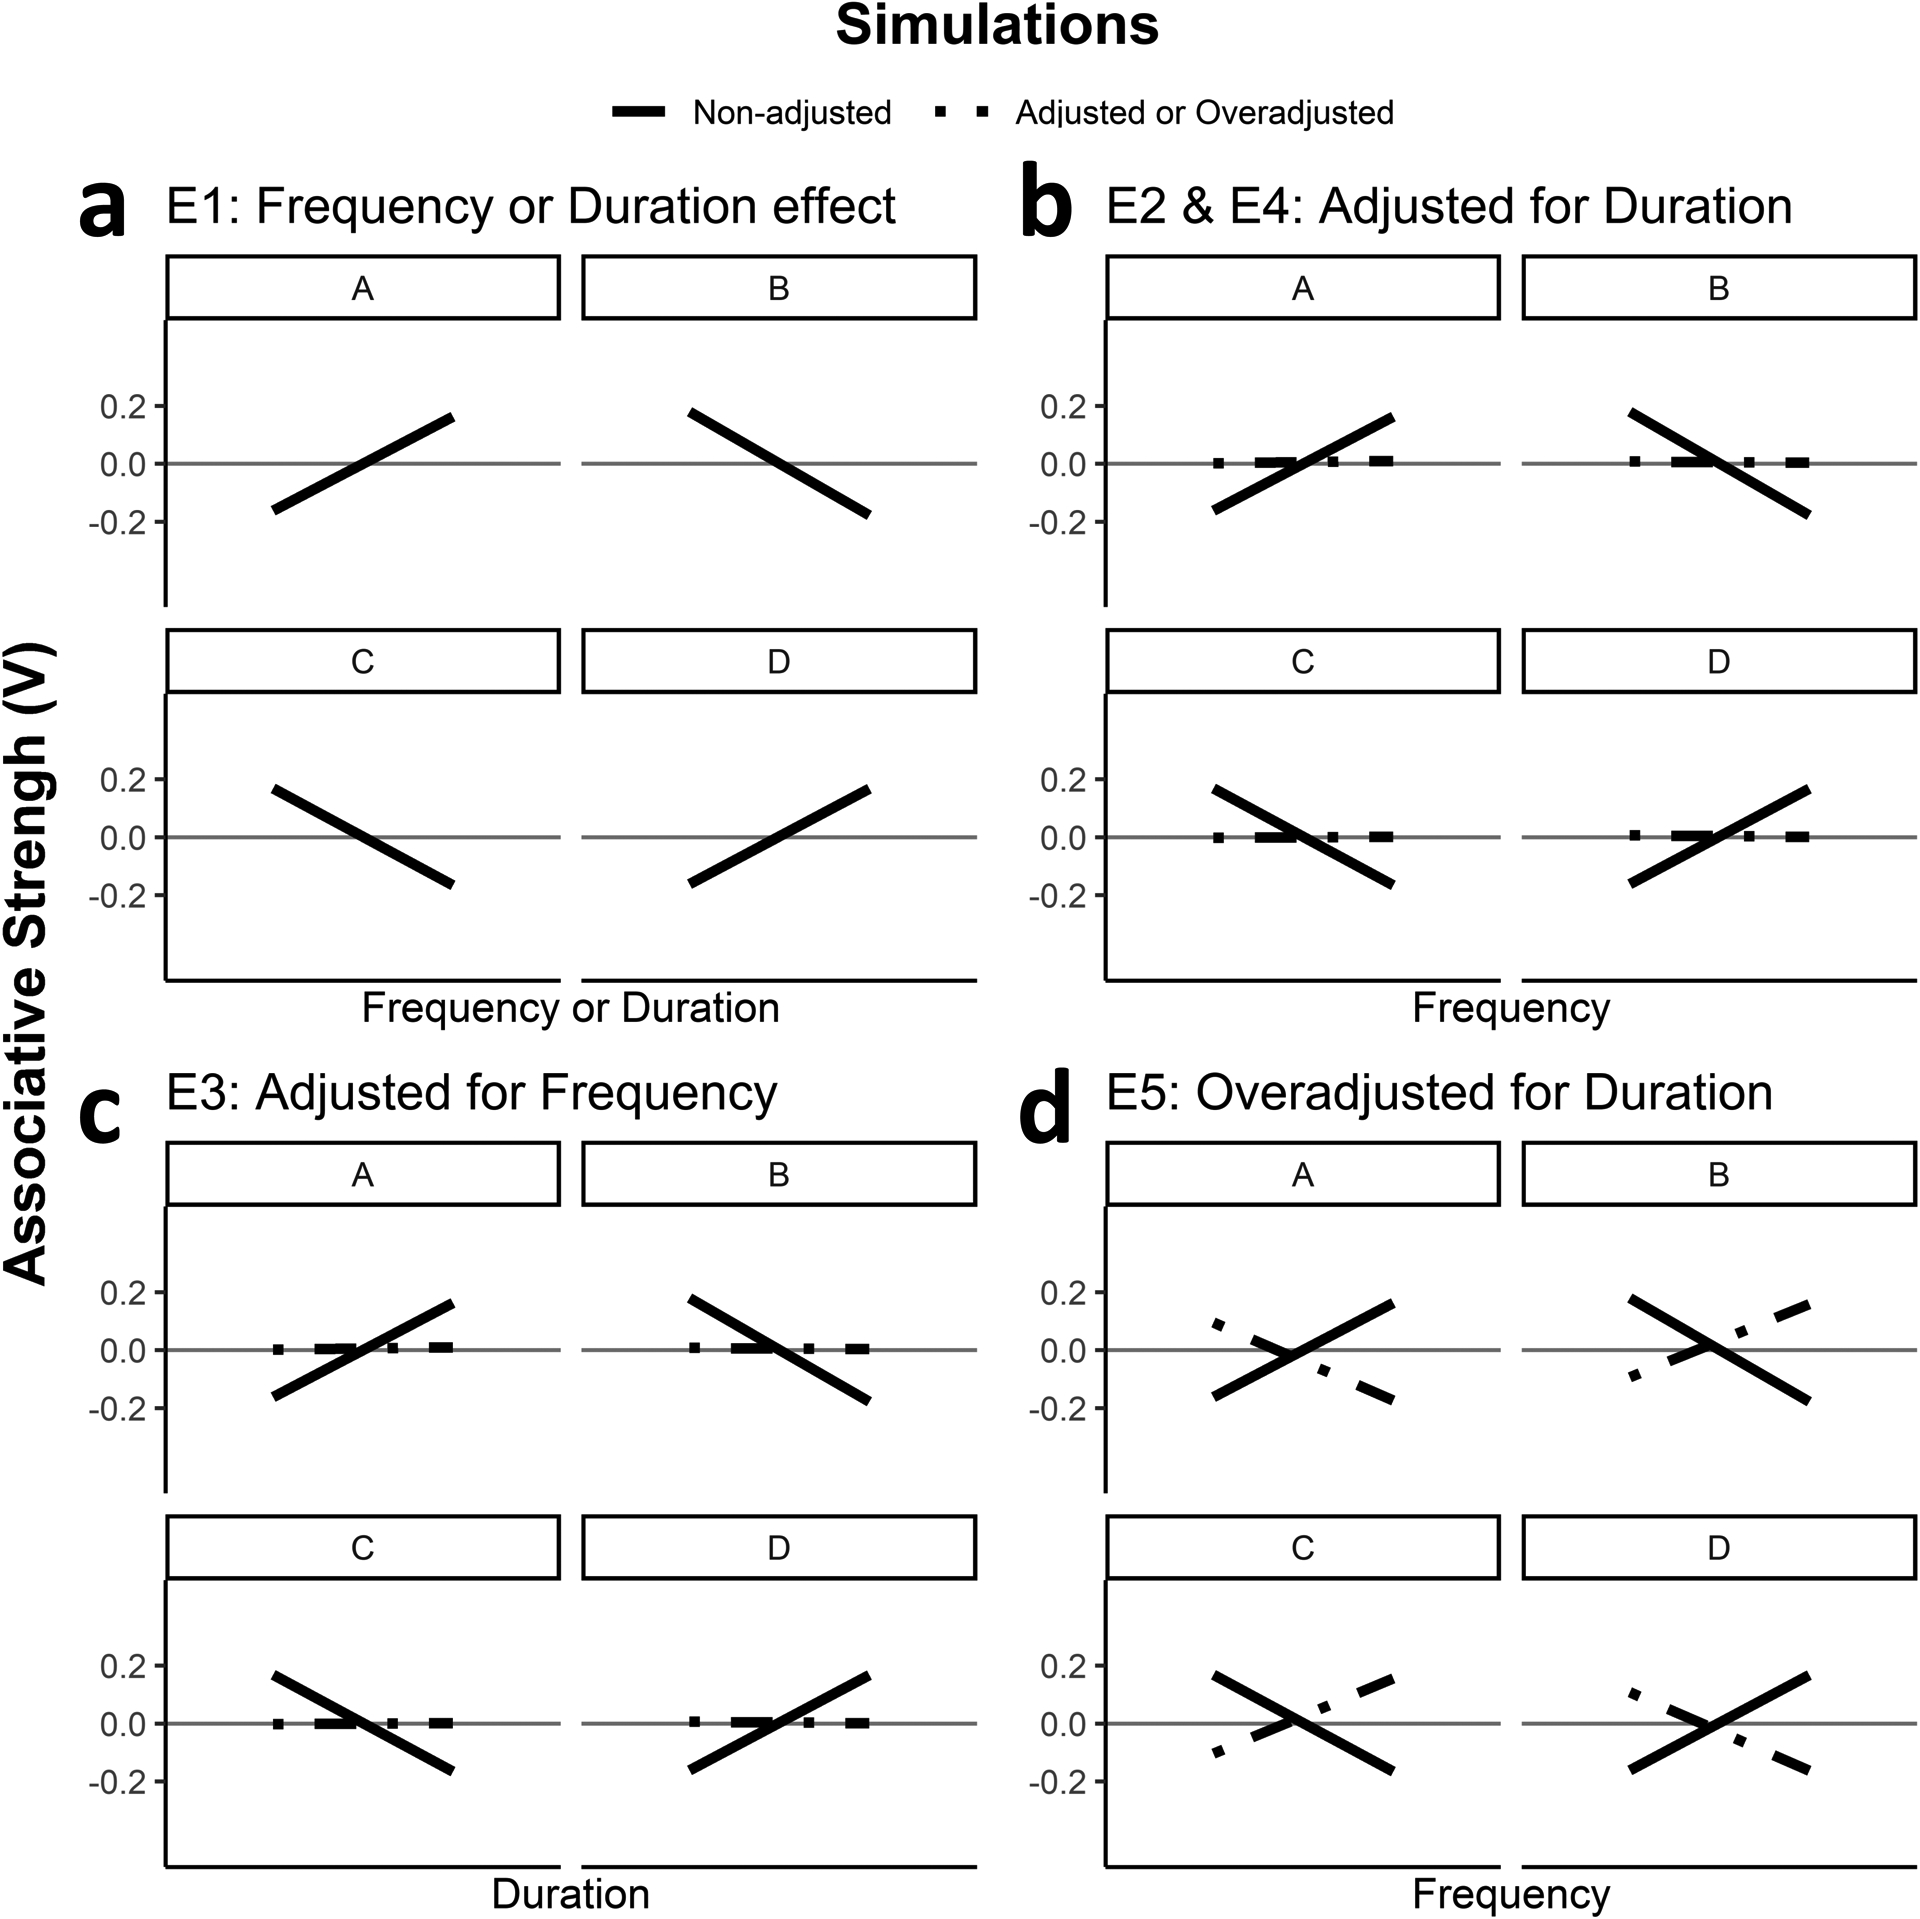
The strength of the learned relation between two events, a model for causal perception, has been found to depend on their overall statistical relation, and might be expected to be related to both training trial frequency and trial duration. We report five experiments using a rapid-trial streaming procedure containing Event 1-Event 2 pairings (A trials), Event 1-alone (B trials), Event 2-alone (C trials), and neither event (D trials), in which trial frequencies and durations were independently varied. Judgements of association increased with increasing frequencies of A trials and decreased with increasing frequencies of both B and C trials but showed little effect of frequency of D trials. Across five experiments, a weak but often significant effect of trial duration was also detected, which was always in the same direction as trial frequency. Thus, both frequency and duration of trials influenced learning, but frequency had decidedly stronger effects. Importantly, the benefit of more trials greatly outweighed the observed reduction in effect size caused by a proportional decrease in trial duration. In experiment 5, more trials of proportionately shorter duration enhanced effects on contingency judgments despite a shortening of the training session. We consider the observed 'frequency advantage' with respect to both frequentist models of learning and models based on information. (PsycInfo Database Record (c) 2022 APA, all rights reserved).


Figures

Figure 1.
Figure 1.
Left-hand panel illustrates the four trial types conceived as relevant for a 2 × 2 contingency between binary events (Allan, 1980). The four squares depict the different instances of the two events E1 (geometric figure) and E2 (object), with their presence and absence varied in the different trial types. Below the squares, the formula for the calculation of the Δp contingency between two binary events is presented as the difference between two conditional probabilities for the occurrence of E2 in the presence of E1 [A/(A+B)] and in the absence of E1[C/(C+D)]. Right-hand panel depicts an example trial stream of two consecutive trials (first a B trial and then an A trial) from the present series of experiments. Participants provided a subjective rating of the relation between the two events (here the rounded square and the shoe). The dimensions are 130 × 130 pixels for the cue and outcome stimuli, and 240 × 190 pixels for the trial marker (TM) borders. Their respective positions are centered at different XY coordinates. For the TM borders: (590, 302) for the top left border, (850, 302) for the top right border, (590, 506) for the bottom left border, and (850, 506) for the bottom right border.
Figure 2.
Figure 2.
Predicted associative strengths for each experiment (E) based on the Rescorla-Wagner (1972) model. Panel a represents the predicted change in associative strength between two events following changes in either frequency or duration of each of the four type of trial independent of the any changes in the other type of trial for Experiment 1. Panel b predictions for Experiment 2 and 4. Panel c predictions for Experiment 3, and Panel d predictions for Experiment 5.
Figure 3.
Figure 3.
Contingency judgement data from Experiment 1a panel a shows the trial Frequency effect, and panel b shows trial Duration effect. The black shapes represent the means with the 95% CIs computed by a bootstrap method (using stat_summary (fun.data = “mean_cl_boot”) function in ggplot2 package; Wickham, 2016). The black lines are linear fit (using geom_smooth(method = “lm”) from ggplot2). At the top of each subplot, the significance of the F-score from the Full model is indicated, where *** is p < 0.001, * is p < 0.05, and nonsignificant (ns). Individual participant points and lines are added with a y-axis jitter in grey.
Figure 4.
Figure 4.
Contingency judgement data from Experiment 1b panel a shows the manipulation of trial Frequency, and panel b shows trial Duration effect. Error bars = 95% CIs. At the top of each subplot, the significance of the F-score from the Full model is indicated, where *** is p < 0.001, ** is p < .01, * is p < 0.05, and non-significant (ns). Individual participant points and lines are added with a y-axis jitter in grey.
Figure 5.
Figure 5.
Judgements of contingency between trained events in the different conditions for Experiment 2 in panel a, and Experiment 3 in panel b. Error bars = 95% CIs.
Figure 6.
Figure 6.
Mean contingency judgements in Experiment 4 in panel a and Experiment 5 in panel b. Error bars = 95% CIs.

References

    1. Allan LG (1980). A note on measurement of contingency between two binary variables in judgment tasks. Bulletin of the Psychonomic Society, 15(3), 147–149.
    1. Allan LG, & Jenkins HM (1983). The effect of representations of binary variables on judgment of influence. Learning and Motivation, 14(4), 381–405.
    1. Allan LG, Hannah SD, Siegel S (2007). The consequences of surrendering a degree of freedom to the participant in a contingency assessment task. Behavioural Processes, 74(2), 265–273. 10.1016/j.beproc.2006.09.007 - DOI - PubMed
    1. Allan LG, Hannah SD, Crump MJC, Siegel S (2008). The psychophysics of contingency assessment. Journal of Experimental Psychology: General, 137(2), 226–243. 10.1037/0096-3445.137.2.226 - DOI - PubMed
    1. Baker AG, Murphy RA, & Vallee-Tourangeau F (1996). Associative and normative models of causal induction: Reacting to versus understanding cause. In Shanks DR, Holyoak KJ, & Medin DL (Eds.), The psychology of learning and motivation (Vol. 34, pp. 1–45). New York: Academic Press. 10.1016/S0079-7421(08)60557-5 - DOI