. 2021 Nov 22;41(12):e0013521.
doi: 10.1128/MCB.00135-21. Epub 2021 Sep 27.

SUMO Modification of PAF1/PD2 Enables PML Interaction and Promotes Radiation Resistance in Pancreatic Ductal Adenocarcinoma

Affiliations

SUMO Modification of PAF1/PD2 Enables PML Interaction and Promotes Radiation Resistance in Pancreatic Ductal Adenocarcinoma

Sanchita Rauth et al. Mol Cell Biol. .

Abstract

RNA polymerase II-associated factor 1 (PAF1)/pancreatic differentiation 2 (PD2) is a core subunit of the human PAF1 complex (PAF1C) that regulates the RNA polymerase II function during transcriptional elongation. PAF1/PD2 has also been linked to the oncogenesis of pancreatic ductal adenocarcinoma (PDAC). Here, we report that PAF1/PD2 undergoes posttranslational modification (PTM) through SUMOylation, enhancing the radiation resistance of PDAC cells. We identified that PAF1/PD2 is preferentially modified by small ubiquitin-related modifier 1 (SUMO 1), and mutating the residues (K)-150 and 154 by site-directed mutagenesis reduces the SUMOylation. Interestingly, PAF1/PD2 was found to directly interact with the promyelocytic leukemia (PML) protein in response to radiation, and inhibition of PAF1/PD2 SUMOylation at K-150/154 affects its interaction with PML. Our results demonstrate that SUMOylation of PAF1/PD2 increased in the radiated pancreatic cancer cells. Furthermore, inhibition of SUMOylation or PML reduces the cell growth and proliferation of PDAC cells after radiation treatment. These results suggest that SUMOylation of PAF1/PD2 interacts with PTM for PDAC cell survival. Furthermore, abolishing the SUMOylation in PDAC cells enhances the effectiveness of radiotherapy. Overall, our results demonstrate a novel PTM and PAF1/PD2 interaction through SUMOylation, and inhibiting the SUMOylation of PAF1/PD2 enhance the therapeutic efficacy for PDAC.

Keywords: PAF1; SUMO1; pancreatic cancer; polymorphonuclear leukocytes; radiation resistance; sumoylation.


Figures

FIG 1
FIG 1
PAF1/PD2 expression is associated with radiation resistance in PDAC cells. (A) Western blot analysis showing knockdown of PAF1/PD2 in SW1990 and CD18/HPAF cells using inducible lentiviral shRNA system (SH25 and SH23 construct). (B and C) PAF1/PD2 knockdown SW1990 and CD18/HPAF cells and control cells were treated with indicated doses of radiation. (B) Colony formation assays were conducted after treating the cells with indicated doses of irradiation, and the difference between the control/control+DOX and knockdown cells was plotted. All the groups were compared to the control (marked by red asterisks), control+DOX (marked by green asterisks), and SH23 -DOX/SH25 -DOX (marked by black asterisks) by Student's t test. Data presented as mean ± SD. *, P < 0.05; **, P < 0.005; and ***, P < 0.001. (C) Representative images of the colony formation assay. (D to E) Immunofluorescence analysis represents YH2AX expression in control and in PAF1/PD2 knockdown cells. (D) Box plot representing the average number of YH2AX foci per cell. *, P< 0.05; n.s, nonsignificant. (E) Representative images showing the PAF1/PD2 and YH2AX expression. (F to G) Immunohistochemistry analysis with anti-PAF1/PD2 antibody was performed in radiation-treated or nonradiated human PDAC samples. (F) Representative images show the PAF1/PD2 staining in indicated samples. (G) Box plot representing the composite score for PAF1/PD2 staining. The number of samples is n = 6 for radiated and nonradiated samples. P = 0.08. (H) Quantitative PCR analysis shows PAF1/PD2 in control and in radiated SW1990 and CD18/HPAF cells. Shown are the averages of triplicate samples. *, P < 0.05. I. Western blot analysis showing the protein expression of PAF1/PD2 in control and in radiation treated SW1990 and CD18/HPAF cells. β-Actin was used as the loading control.
FIG 2
FIG 2
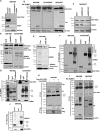
SUMO1 posttranslationally modifies PAF1/PD2. (A) PAF1/PD2 slower migrating band expression was examined in nuclear and cytoplasmic lysate from SW1990 cells by Western blot analysis using anti-PAF1/PD2 antibody. PARP and GAPDH were used as nuclear and cytoplasmic loading control, respectively. (B) Western blot analysis on lysates collected from HA-SUMO1 transfected SW1990, CD18/HPAF, and HEK293T cells represents the expressional variation of higher molecular weight band of PAF1/PD2 (indicated by the orange line). (C) Western blot analysis of PAF1/PD2 and UBC9 in UBC9 knockdown HEK293T cells. The arrow indicates the slower migrating band of PAF1/PD2. β-Actin was used as the loading control. (D) Western blot analysis of PAF1/PD2 and SUMO1 in SUMO1 knockdown SW1990 and CD18/HPAF cells. The arrow indicates the slower migrating band of PAF1/PD2. β-Actin was used as the loading control. (E) Western blot analysis of PAF1/PD2 (the arrow indicates the slower migrating band of PAF1/PD2) and SUMO1 of SW1990 cell lysate after treatment with 500 nM TAK-981. β-Actin was used as the loading control. (F and G) Immunoprecipitation analysis was performed on protein lysates from SW1990 and CD18/HPAF cells using PAF1/PD2 antibody (F) and SUMO-1 antibody (G). Immunoblot analysis of immunoprecipitates was performed with SUMO1-specific (F) and PAF1/PD2-specific (G) antibodies. (H) HEK293T cells were transiently transfected with HA-SUMO1 and Flag-PAF1/PD2 as indicated. Immunoprecipitation and immunoblotting with anti-HA and Flag antibodies represent the interaction of Flag-PAF1/PD2 with HA-SUMO1. (I) SW1990 and HEK293T cells were transiently transfected with HA-SUMO1 followed by immunoprecipitation with anti-HA antibody and Western blotting with PAF1/PD2 antibody. (J) Lysates from SW1990 cells were used for immunoprecipitation with anti-PAF1/PD2 antibody. PAF1/PD2 precipitates were then used for Western blotting and probed with anti-SUMO2/3 antibody.
FIG 3
FIG 3
Identification of candidate SUMO sites on PAF1/PD2. (A) Alignment of PAF1/PD2 containing the putative SUMOylation site; K47, K106, K133, K150, and K154 from multiple species. The putative SUMOylation site is highlighted in red. (B) JAASA software prediction of candidate SUMO acceptors on PAF1/PD2. The site was highlighted in blue. (C to D) HA-SUMO1 plasmids were cotransfected with Flag-PAF1/PD2 WT or Flag-PAF1/PD2 lysine single-mutant plasmids to HEK293T cells. (C) Immunoprecipitation with anti-Flag and immunoblotting with anti-HA antibody represents the interaction between the two proteins. The whole-cell lysate (WCL) was immunoblotted with anti-Flag, anti-HA, and β-actin antibodies. (D) The bar graph showing the quantified result of the fold change of SUMO-PAF1/PD2 (represented by HA in the IP data) to total PAF1/PD2 (represented by Flag in the IP data). As the first two groups do not involve the transfection with Flag-PAF1/PD2 and did not show any band for Flag, it was not included in the graph. Values are presented as mean ± SE, n = 2. (E) Flag-PAF1/PD2 WT, Flag-PAF1/PD2 K106R, or Flag-PAF1/PD2 K150/154R plasmid was cotransfected with HA-SUMO1 to HEK293T cells. Immunoblotting with anti-HA of the Flag immunoprecipitates represents the PAF1/PD2 SUMOylation status at Lys-106, -150, and -154 sites. (F) Protein stability assay using cycloheximide (30 μg/ml) was performed in HEK293T cells transfected with Flag-PAF1/PD2 alone or with HA-SUMO1 and HA-UBC9. Lysates were collected at indicated time points and immunoblotting was performed with indicated antibodies. (G) Flag-PAF1/PD2 WT and SUMO site mutated Flag PAF1/PD2 150/154R (Flag-PAF1/PD2 KR mutated) protein expression was examined in nuclear and cytoplasmic lysate from HEK293T cells by Western blot analysis using anti-Flag antibody. Histone3 and GAPDH were used as loading controls. (H) PAF1/PD2 expression was examined in nuclear and cytoplasmic lysate from SW1990 and CD18/HPAF cells after treatment with TAK-981 (500 nM). Histone3 and GAPDH were used as nuclear and cytoplasmic loading control, respectively.
FIG 4
FIG 4
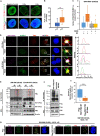
Radiation triggers recruitment of SUMOylated PAF1/PD2 to PML-NBs. (A and B) Analysis of PAF1/PD2-PML interaction by in situ PLA assay. PLA was performed using anti-PAF1/PD2 and anti-PML antibodies after treating the cells with indicated doses of radiation. Negative control was subjected to PLA with anti-PML antibody only. (A) Representative images are shown. Scale bar represents 5 μm. (B) Graph showing the mean of PLA spots per cell ± SD. As PLA performed with PML only—negative control—did not show spots, it was not included in the graph, but it is provided as a representative image. Values are presented as means ± SD (**, P < 0.005). (C and D) Immunofluorescence analysis of PAF1/PD2 knockdown and control cells before and after treatment with 5 Gy radiation. (C) Box plot representing the number of colocalized PAF1/PD2, SUMO1, and PML foci (white dots) per cell (SW1990 SH25). (D) Cells are stained with anti-PML, anti-PAF1/PD2, and anti-SUMO1 antibodies, and the colocalization of all three proteins is seen as white dots. Insets show magnified regions (dashed boxes) highlighting the colocalization of PAF1/PD2, SUMO1, and PML. Scale bar, 10 μm. The histograms represent the fluorescence intensity profile along the dotted lines. (E) Immunoprecipitation analysis demonstrating the physical interaction of PAF1/PD2 with PML in response to radiation in control and PAF1/PD2 knockdown cells. (F) Immunoprecipitation analysis showing the interaction of Flag-PAF1/PD2 WT or Flag-PAF1/PD2 KR Mut. with PML. (G) Confocal analysis showing the colocalization of PML, Flag-PAF1/PD2 WT, or Flag-PAF1/PD2 KR Mut. and SUMO1 (white dots in the merged image). Scale bar, 5 μm. (H) Quantification of the number of colocalized foci per cell (white dots: Flag-PAF1/PD2 WT or Flag-ΔPAF1/PD2, SUMO1, and PML) is shown and analyzed as a boxplot.
FIG 5
FIG 5
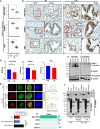
Radiation treatment in PDAC cells enhances the PAF1/PD2 SUMOylation and increases the PAF1/PD2, SUMO1, and PML expression. (A) Publicly available pancreatic cancer RNA seq data sets from TCGA and GeTx were analyzed using the GEPIA interactive web server. Expression of the PAF1/PD2, PML, and SUMO1 was compared between normal and tumor samples as given as log2(TPM + 1) (*, P < 0.05). (B to C) IHC staining of PAF1/PD2, SUMO1, and PML in formalin fixed radiation-treated and non-radiation-treated PDAC patient issue sections. (A) Representative images show the PAF1/PD2 staining in indicated samples. Scale bar, 250 μm. (B) The graph represents the composite score for PAF1/PD2, SUMO1, and PML staining. The number of samples are n = 9 and n = 10 for radiated and nonradiated groups, respectively. *, P < 0.05. (D) Immunoblotting analysis shows the expression variation for SUMO1 and SUMO1 conjugates in SW1990 and CD18/HPAF cells treated with the indicated radiation dose. (E) Immunofluorescence analysis shows the colocalization of SUMO1 and PAF1/PD2 in control and in radiation treated Flag-PAF1/PD2 WT and Flag-PAF1/PD2 KR Mut. expressing cells. The histograms represents the fluorescence intensity profile along with the dotted circles. Scale bar, 5 μm. The graph represents the quantitative data showing the percentage of PAF1/PD2 and SUMO-1 colocalization. Data are presented as mean ± SD. (F) Immunoprecipitation analysis was performed on protein lysates from SW1990 SH25 cells (expressing PAF1/PD2 WT and PAF1/PD2 KR mut. protein) after treatment with 5 Gy of radiation using SUMO-1 antibody. Immunoblot analysis of immunoprecipitates was performed with indicated antibodies. (G) GEPIA interactive web server showed an increased in PAF1/PD2 expression compared to CTR9, LEO1, and CDC73 in PDAC tumor samples.
FIG 6
FIG 6
PAF1/PD2 SUMOylation enhances cell survival of PDAC cells after radiation treatment. (A to D) PAF1/PD2 knockdown SW1990 (SH25) and CD18/HPAF (SH25) cells were transfected with Flag-PAF1/PD2 WT and Flag-PAF1/PD2 K150/154R (Flag-PAF1/PD2 KR mut.) plasmids and treated with 5 Gy irradiation. PML knockdown and TAK-981 (500 nM) treatment were performed in control cells followed by transfection with Flag-PAF1/PD2 WT and Flag-PAF1/PD2 KR mut. plasmid and treatment with 5 Gy of radiation. (A) Cell proliferation analysis quantified using the Incucyte Systems for Live-Cell Imaging and Analysis instrument for indicated time periods. All the groups were compared to the control (marked by red asterisks) and control+DOX (marked by teal asterisks) by Student's t test. Data presented as mean ± SD. *, P < 0.05; **, P < 0.005; and ***, P < 0.001. (B) Bar graph showing the apoptotic index in cells at indicated time points after radiation treatment quantified using the Incucyte Systems for Live-Cell Imaging and Analysis instrument. All the groups were compared to the control (marked by red asterisks) and control+DOX (marked by teal asterisks) by nonparametric Student's t test. Data presented as mean ± SD. *, P < 0.05; **, P < 0.005; and ***, P < 0.001. (C) Representative images of cells from indicated groups (taken from Incucyte). (D) Colony formation assay showing the average number of colonies formed after 15 days. Groups were compared to the control (marked by red asterisks) and control+DOX (marked by teal asterisks) by Student's t test. Data presented as mean ± SD. *, P< 0.05; **, P < 0.005; and ***, P < 0.001. (D) Schematic model depicting the PAF1/PD2 SUMOylation by SUMO1 and its role in radioresistance by interacting with PML.

Similar articles

Cited by

References

    1. Siegel RL, Miller KD, Fuchs HE, Jemal A. 2021. Cancer statistics, 2021. CA A Cancer J Clin 71:7–33. 10.3322/caac.21654. - DOI - PubMed
    1. Vincent A, Herman J, Schulick R, Hruban RH, Goggins M. 2011. Pancreatic cancer. Lancet 378:607–620. 10.1016/S0140-6736(10)62307-0. - DOI - PMC - PubMed
    1. Kooby DA, Gillespie TW, Liu Y, Byrd-Sellers J, Landry J, Bian J, Lipscomb J. 2013. Impact of adjuvant radiotherapy on survival after pancreatic cancer resection: an appraisal of data from the national cancer data base. Ann Surg Oncol 20:3634–3642. 10.1245/s10434-013-3047-x. - DOI - PMC - PubMed
    1. Barhoumi M, Mornex F, Bonnetain F, Rougier P, Mariette C, Bouché O, Bosset JF, Aparicio T, Mineur L, Azzedine A, Hammel P, Butel J, Stremsdoerfer N, Maingon P, Bedenne L, Chauffert B. 2011. Locally advanced unresectable pancreatic cancer: induction chemoradiotherapy followed by maintenance gemcitabine versus gemcitabine alone: definitive results of the 2000–2001 FFCD/SFRO phase III trial. Cancer Radiother 15:182–191. 10.1016/j.canrad.2010.10.001. - DOI - PubMed
    1. Seshacharyulu P, Baine MJ, Souchek JJ, Menning M, Kaur S, Yan Y, Ouellette MM, Jain M, Lin C, Batra SK. 2017. Biological determinants of radioresistance and their remediation in pancreatic cancer. Biochim Biophys Acta Rev Cancer 1868:69–92. 10.1016/j.bbcan.2017.02.003. - DOI - PMC - PubMed

Publication types

MeSH terms

LinkOut - more resources