. 2022 Feb 3;139(5):651-665.
doi: 10.1182/blood.2021012231.

The megakaryocytic transcription factor ARID3A suppresses leukemia pathogenesis

Affiliations

The megakaryocytic transcription factor ARID3A suppresses leukemia pathogenesis

Oriol Alejo-Valle et al. Blood. .

Abstract

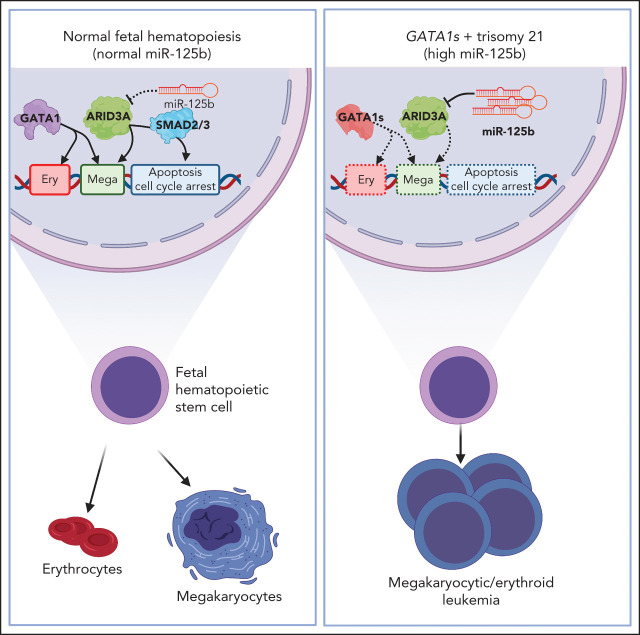
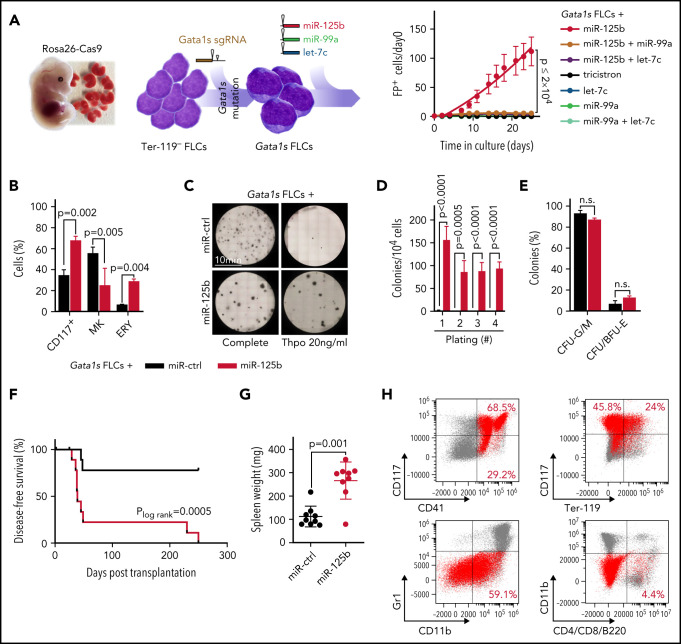
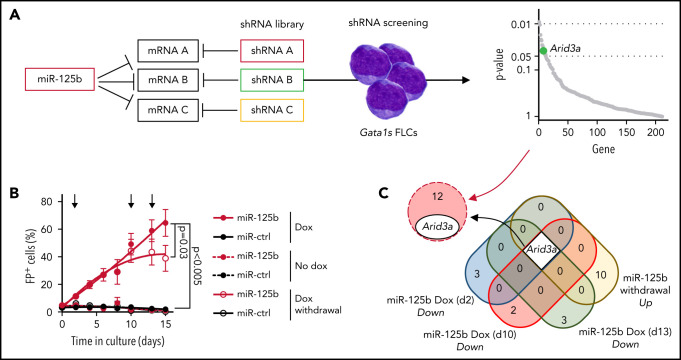
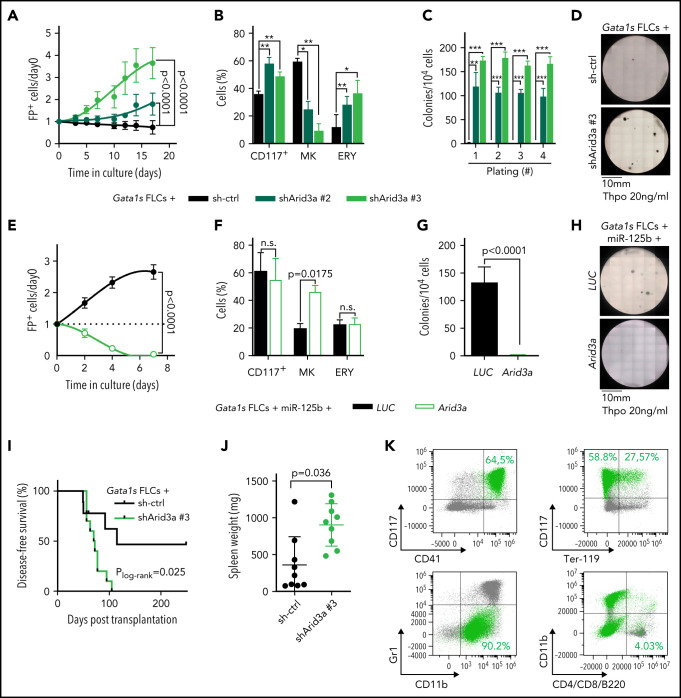
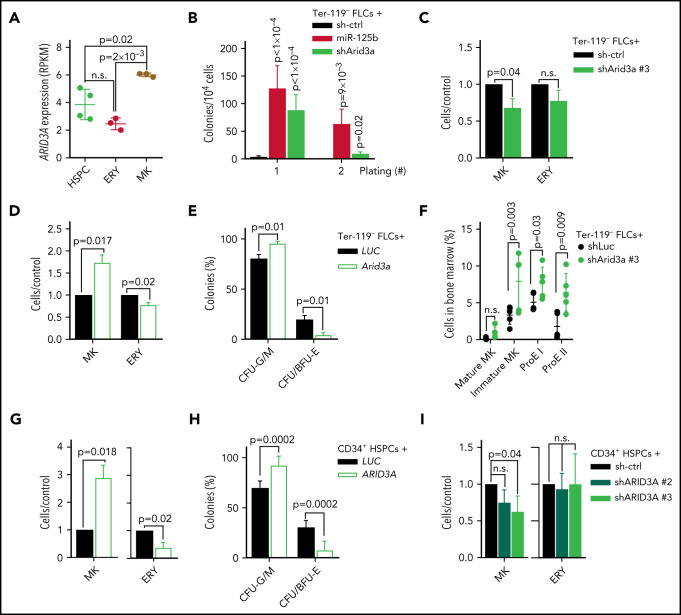
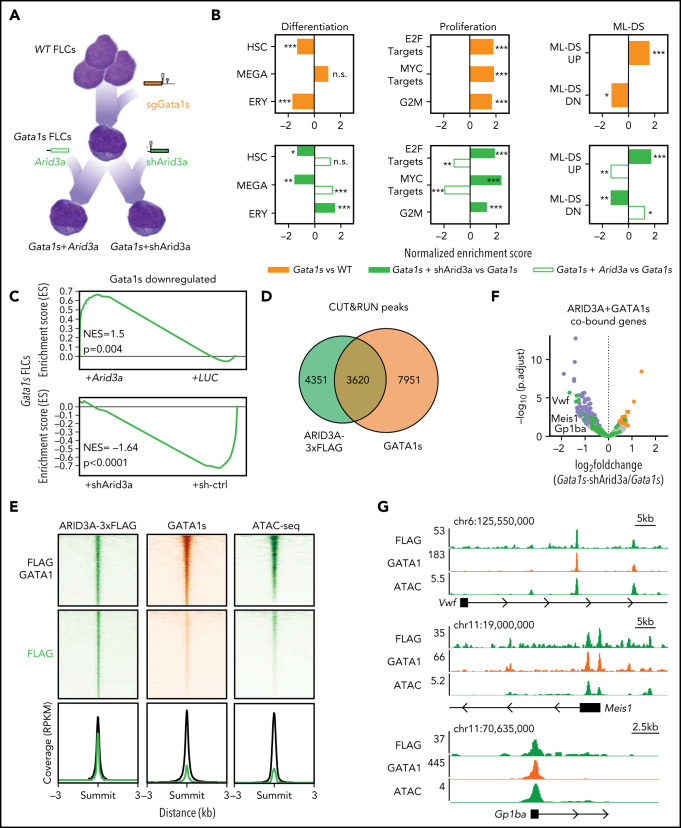
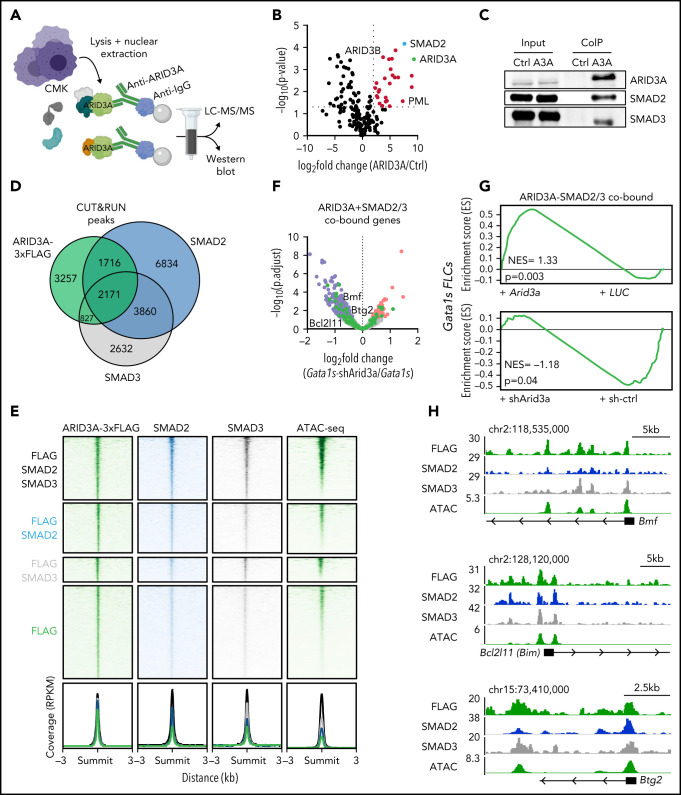
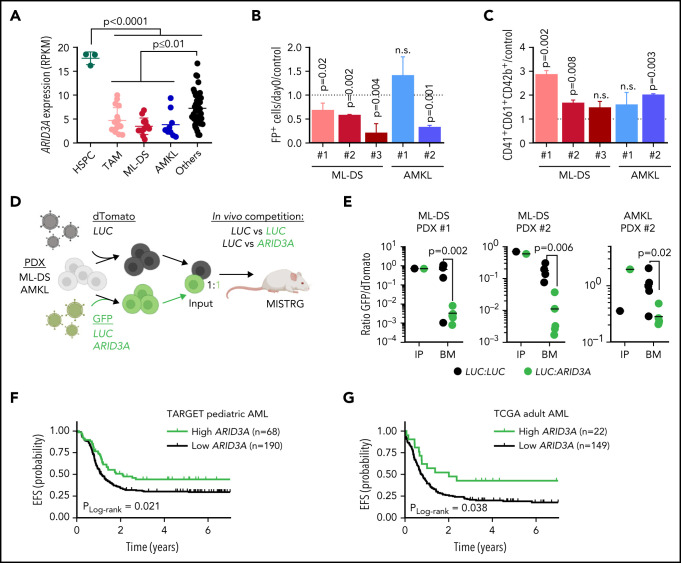
Given the plasticity of hematopoietic stem and progenitor cells, multiple routes of differentiation must be blocked in the the pathogenesis of acute myeloid leukemia, the molecular basis of which is incompletely understood. We report that posttranscriptional repression of the transcription factor ARID3A by miR-125b is a key event in the pathogenesis of acute megakaryoblastic leukemia (AMKL). AMKL is frequently associated with trisomy 21 and GATA1 mutations (GATA1s), and children with Down syndrome are at a high risk of developing the disease. The results of our study showed that chromosome 21-encoded miR-125b synergizes with Gata1s to drive leukemogenesis in this context. Leveraging forward and reverse genetics, we uncovered Arid3a as the main miR-125b target behind this synergy. We demonstrated that, during normal hematopoiesis, this transcription factor promotes megakaryocytic differentiation in concert with GATA1 and mediates TGFβ-induced apoptosis and cell cycle arrest in complex with SMAD2/3. Although Gata1s mutations perturb erythroid differentiation and induce hyperproliferation of megakaryocytic progenitors, intact ARID3A expression assures their megakaryocytic differentiation and growth restriction. Upon knockdown, these tumor suppressive functions are revoked, causing a blockade of dual megakaryocytic/erythroid differentiation and subsequently of AMKL. Inversely, restoring ARID3A expression relieves the arrest of megakaryocytic differentiation in AMKL patient-derived xenografts. This work illustrates how mutations in lineage-determining transcription factors and perturbation of posttranscriptional gene regulation can interact to block multiple routes of hematopoietic differentiation and cause leukemia. In AMKL, surmounting this differentiation blockade through restoration of the tumor suppressor ARID3A represents a promising strategy for treating this lethal pediatric disease.


Figures

None
Graphical abstract
Figure 1.
Figure 1.
miR-125b cooperates with Gata1s to induce leukemia in vivo. (A) In vitro and in vivo setup for modeling synergy between Gata1s and the members of the miR-99a-125b tricistron (left). Percentage of Gata1s FLCs transduced with different miRNA permutations (marked by dTomato [miR-125b], mTagBFP2 [let-7c], and GFP [miR-99a]) normalized to that on day 0 (n = 4; 1-way ANOVA) (right). (B) Bar graph showing the percentage of stem/progenitor cells (CD117+), mature megakaryocytes (MK, CD41+CD42d+), and erythroid cells (ERY, CD71+Ter-119+) after 6 days of differentiation. Cells shown are Gata1s FLCs transduced with miR-125b or miR-ctrl (n = 3, paired Student t test). (C) Representative methylcellulose-based CFU assays from 1 of 4 independent experiments. Gata1s FLCs transduced with miR-ctrl or miR-125b are depicted in complete or low (Thpo 20 ng/mL) cytokine conditions. (D) The number of megakaryocyte colonies after serial replating of miR-125b Gata1s FLCs in methylcellulose-based medium with low (Thpo 20 ng/mL) cytokine conditions, compared with miR-ctrl Gata1s FLCs (n = 4, unpaired Student t test). (E) Classification of colonies after plating miR-125b or miR-ctrl Gata1s FLCs in methylcellulose-based CFU assays under complete cytokine conditions (n = 2, 2-way ANOVA). Combined granulocytic (CFU-G) and monocytic (CFU-M) CFUs: granulocytic/monocytic (CFU-G/M); and CFU/BFU-E, erythroid. (F-H) Analysis of mouse recipients of Gata1s FLCs overexpressing miR-125b or miR-ctrl (n = 10 per group), including comparisons of Kaplan-Meier survival curves (log-rank test) (F), spleen weights (unpaired Student t test) (G), and representative flow cytometry plots of bone marrow–derived leukemic cells (H) in the diseased mice. miR-125b–overexpressing Gata1s FLC-derived blasts are highlighted in red. The average percentage of miR-125b+ blasts belonging to each immunophenotype is indicated in each corresponding gate. Data are the mean ± standard deviation. FP+, fluorescent protein positive; n.s., not significant.
Figure 2.
Figure 2.
shRNA-based positive selection screening in combination with RNA-seq identifies miR-125b targets that synergize with Gata1s. (A) shRNA+ selection screening, in which a pool of shRNAs directed against miR-125b target genes was used to mimic the effect of miR-125b (left). Dot plot showing significantly enriched shRNA-targeted genes (right). Significance was defined as P < .05 (n = 12). Arid3a is highlighted in green. (B) The percentage of Gata1s FLCs expressing doxycycline-regulated miR-125b or miR-ctrl upon addition and removal of doxycycline (500 ng/mL). Arrows indicate time points used for gene expression analysis. Data are the mean ± standard error of the mean (n = 4, paired Student t test). FP+, fluorescent protein positive. (C) Venn diagram of differentially expressed genes after miR-125b modulation (compared with miR-ctrl), overlapping with the 13 enriched genes from the shRNA+ selection screen in panel A.
Figure 3.
Figure 3.
Arid3a knockdown mimics the miR-125b phenotype in Gata1s FLCs. (A) Percentage of transduced (sh-ctrl or shArid3a #2 or #3) Gata1s FLCs compared with that on day 0 (n = 4, 2-way ANOVA). (B) Percentage of stem/progenitor cells (CD117+), mature megakaryocytes (MK, CD41+ CD42d+), and erythroid cells (ERY, CD71+Ter-119+) in transduced (sh-ctrl or shArid3a #2 or #3) Gata1s FLCs after 6 days of differentiation (n = 3, paired Student t test). (C-D) Serial replating of transduced (sh-ctrl or shArid3a #2 or #3) Gata1s FLCs in methylcellulose-based medium with low concentrations of Thpo (20 ng/mL). (C) The number of megakaryocyte colonies, with the serial replating number on the x-axis (n = 4, 2-way ANOVA) (C), alongside a representative image from the first plating of 4 independent experiments (D). (E) Percentage of cDNA-transduced (Arid3a or LUC) miR-125b-Gata1s FLCs normalized to that on day 0 (n = 4, unpaired Student t test). (F) Percentage of stem/progenitor cells (CD117+), mature megakaryocytes (MK, CD41+CD42d+), and erythroid cells (ERY, CD71+Ter-119+) in cDNA-transduced (Arid3a or LUC) miR-125b-Gata1s FLCs after 6 days of differentiation (n = 3, paired Student t-test). (G-H) Methylcellulose-based colony-forming assays of cDNA-transduced (Arid3a or LUC) miR-125b Gata1s FLCs in low Thpo conditions (20 ng/mL; n = 4, unpaired Student t test). (G) The number of colonies (depicted in panel H) alongside a representative image from 4 independent experiments. (I-K) Analysis of C57BL/6J recipients of shRNA-transduced (sh-ctrl or shArid3a) Gata1s FLCs, including Kaplan-Meier survival curves (log-rank test) (I), spleen weights (unpaired Student t test) (J), and representative flow cytometry plots of BM-derived leukemic cells from the diseased mice (K). shArid3a-expressing Gata1s FLC–derived blasts are highlighted in green. The average percentage of shArid3a+ blasts belonging to each immunophenotype is indicated in the corresponding gate. All data are presented as the mean ± standard deviation. *P < .05; **P < .01; ***P < .001. FP+, fluorescent protein positive; n.s., not significant.
Figure 4.
Figure 4.
ARID3A promotes terminal megakaryocytic differentiation. (A) ARID3A expression (reads per kilobase of transcript per million mapped reads, RPKM) in sorted HSPCs (peripheral blood [PB] mobilized CD34+ cells; n = 4), megakaryocyte (MK; CD41+CD61+; n = 3), and erythroid cells (CD71+, n = 3) derived from PB CD34+ HSPCs after 7 days of differentiation in megakaryocyte- or erythroid-promoting culture conditions (1-way ANOVA). (B) Colony counts after replating sh-ctrl-, miR-125b-, or shArid3a-transduced murine FLCs in low Thpo methylcellulose-based CFU assays (n = 6; 2-way ANOVA). The serial replating number is shown on the x-axis. (C-D) Ratio of terminal megakaryocyte (MK, CD41+CD42d+) and erythroid cells (ERY, CD71+Ter-119+) in shArid3a- vs sh-ctrl-transduced murine FLCs (C) and in Arid3a- vs LUC-transduced FLCs (D) after 6 and 4 days of differentiation, respectively (n = 3; paired Student t test). (E) Classification of colonies after plating cDNA-transduced (Arid3a or LUC) murine FLCs in methylcellulose-based CFU assays under complete cytokine conditions (n = 3; 2-way ANOVA). CFU-G/M: granulocytic (CFU-G), monocytic (CFU-M) and granulocytic/monocytic (CFU-GM); CFU/BFU-E: erythroid. (F) Dot plot showing the percentage of mature megakaryocytes (mature MK, CD41+CD42d+), immature megakaryocytes (Immature MK, CD41+CD42), early erythroblasts (ProE I, CD71+Ter-119+), and late erythroblasts (ProE II, CD71Ter-119+) in the BM of mouse recipients of shRNA-transduced Ter-119 FLCs (sh-ctrl or shArid3a). shRNA+ cells shown (n = 5, unpaired Student t test). (G) Percentage of differentiated cells after transduction of human PB CD34+ HSPCs with ARID3A cDNA, normalized to LUC-transduced HSPCs (n = 6; paired Student t test). Percentage of mature megakaryocytes (CD41+/CD61+/CD42+) after 11 days in medium promoting megakaryocytic differentiation (left). Percentage of mature erythroid cells (CD71+CD235a+) after 7 days in medium promoting erythroid differentiation (right). (H) Classification of colonies after plating ARID3A- or LUC-expressing human PB CD34+ HSPCs in methylcellulose-based CFU assays under complete cytokine conditions (n = 6, 2-way ANOVA). (I) Percentage of terminally differentiated cells after transduction of human PB CD34+ HSPCs with shRNAs targeting ARID3A, normalized to sh-ctrl (n = 3; paired Student t test). Percentage of mature megakaryocytes (CD41+CD61+CD42+) after 11 days in medium promoting megakaryocytic differentiation (left). Percentage of mature erythroid cells (CD71+CD235a+) after 7 days in medium promoting erythroid differentiation (right). Data are presented as the mean ± standard deviation. n.s., not significant.
Figure 5.
Figure 5.
ARID3A acts in concert with GATA1 to activate megakaryocytic transcriptional programs. (A) Characterizing the molecular function of ARID3A in TAM/ML-DS leukemogenesis via sequential Gata1s acquisition and Arid3a repression. Gata1s FLCs were expanded for 3 weeks and then transduced with Arid3a cDNA, shArid3a #3 or their respective controls. RNA samples were obtained from each of the 4 different conditions and subjected to RNA-seq–based gene expression analysis (n = 2-3). (B) Normalized enrichment scores for up- or downregulated gene sets involved in hematopoietic differentiation, cell proliferation, and ML-DS progression. Gata1s FLCs were compared against wild-type FLCs (top); Arid3a and shArid3a Gata1s FLCs were compared against their respective Gata1s FLCs controls (LUC or sh-ctrl) after doxycycline induction (bottom). *P < .05; **P < .01; ***P < .001. (C) GSEA enrichment plots showing genes downregulated by the Gata1s mutation in FLCs, and their response to Arid3a modulation in Gata1s FLCs. (D) Venn diagram showing the number of genomic regions bound by ARID3A and/or GATA1s. The data were generated using CUT&RUN after the doxycycline-induced Arid3a expression in miR-125b-expressing Gata1s FLCs. Significantly enriched peaks were called using SEACR (sparse enrichment analysis for CUT&RUN. (E) Heat maps depict the colocalization of ARID3A (green, left) and GATA1s (orange, middle) and chromatin accessibility (green, right) signals after doxycycline-induced Arid3a expression in miR-125b-expressing Gata1s FLCs. The data were generated by CUT&RUN (colocalization) and ATAC-seq (accessibility). Regions ±3 kb of the peak center are shown. Aggregate signals of single- and co-occupied regions are also provided (bottom; cobound [black] and ARID3A-bound only [green] are indicated). (F) Volcano plot showing the differential expression of ARID3A/GATA1s cobound genes after Arid3a knockdown in Gata1s FLCs. Genes involved in megakaryocytic differentiation (green), significantly downregulated (blue) and upregulated (red) genes, and nonsignificantly changed genes (gray). (G) IGV snapshots of megakaryocytic genes, showing co-occupancy by ARID3A and GATA1 and chromatin accessibility (ATAC). The tracks display coverage (RPKM) (left). Scale and chromosome location are shown (top). n.s., not significant.
Figure 6.
Figure 6.
ARID3A interacts with SMAD2/3 and promotes TGFβ pathway activation. (A) Experimental design for isolating ARID3A-containing protein complexes from CMK cells. (B) Volcano plot showing enriched proteins in LC-MS/MS after ARID3A pulldown, compared with the IgG control (n = 2). Significantly-enriched proteins (red); and ARID3A (green) and SMAD2 (blue). (C) Western blot confirming the coimmunoprecipitation of SMAD2 and SMAD3 and ARID3A. (D) Venn diagram showing the number of genomic regions bound by ARID3A, SMAD2 and/or SMAD3. The data were obtained via CUT&RUN, after the doxycycline-induced Arid3a expression in miR-125b-expressing Gata1s FLCs. Significantly enriched peaks were called using SEACR. (E) Heat maps depicting the colocalization of ARID3A (green, left), SMAD2/3 (blue and gray, middle), and chromatin accessibility (green, right) signals after doxycycline-induced Arid3a expression in miR-125b-expressing Gata1s FLCs. The data were generated using CUT&RUN and ATAC-seq, respectively. Regions ±3 kb of the peak center are shown. Aggregate signals of single- and co-occupied regions are also provided (bottom; ARID3A and SMAD2/3 cobound [black], ARID3A and SMAD2 cobound [blue], ARID3A and SMAD3 cobound [gray], and ARID3A-bound only [green] are indicated). (F) Volcano plot showing the differential expression of ARID3A and SMAD2/3 cobound genes upon Arid3a knockdown in Gata1s FLCs. Genes involved in apoptosis and cell cycle arrest (green); significantly downregulated (blue) and upregulated (red) genes; non-significantly changed genes (gray). (G) GSEA enrichment plots showing genes bound by ARID3A, SMAD2 and SMAD3, and their response to Arid3a modulation in Gata1s FLCs. (H) Integrative Genomics Viewer snapshots of genes involved in apoptosis and cell cycle arrest, showing occupancy of the ARID3A-SMAD2-SMAD3 protein complex and chromatin accessibility (ATAC). The tracks display coverage (RPKM) (left). Scale and chromosome location are shown (top).
Figure 7.
Figure 7.
Restoring ARID3A expression reestablishes normal differentiation of leukemic blasts. (A) ARID3A expression (RPKM) in fetal CD34+ HSPCs (n = 3) and sorted pediatric AML blasts of different subtypes: TAM (n = 16), ML-DS (n = 13), and AMKL (n = 9); others include CBFB-MYH11 (n = 12), RUNX1-RUNX1T1 (n = 8), KMT2A-MLLT10 (n = 10), and KMT2A-MLLT3 (n = 8) (1-way ANOVA). (B-C) AMKL and ML-DS PDXs were transduced with doxycycline-inducible ARID3A or LUC cDNA vectors. (B) Normalized percentage of ARID3A+ cells after a 12-day induction with doxycycline, normalized to the LUC control. (C) Normalized percentage of ARID3A+ terminally differentiated megakaryocytes (CD41+CD61+CD42+) after an 8-day induction with doxycycline, normalized to the LUC control (n = 3 per PDX, unpaired Student t test vs the respective control). (D) Experimental design for evaluating ARID3A restoration in vivo. Leukemic blasts were transduced with ARID3A (GFP+) or a LUC control (GFP+) and mixed 1:1 with LUC control-transduced blasts (dTomato+), before transplantation into sublethally irradiated recipient mice. (E) Ratio of GFP+ to dTomato+ cells in input cells (IP), and in the bone marrow (BM) of mice euthanized 4 to 5 weeks after transplantation (n = 5, unpaired Student t test). (F) Probability of event-free survival (EFS) in 258 NCI-TARGET pediatric patients with AML, with high (green; >12.0 normalized reads; cutoff determined via maximally selected rank statistics) or low ARID3A expression (black; ≤12.0 normalized reads). (G) Probability of EFS in 171 TCGA (The Cancer Genome Atlas) adult patients with AML with high (green; >12.3 normalized reads; cutoff determined via maximally selected rank statistics) or low ARID3A expression (black; ≤12.3 normalized reads). (A-C,E) Data are the mean ± standard deviation. FP+, fluorescent protein positive; n.s., not significant.

Comment in

References

    1. Sanz MA, Grimwade D, Tallman MS, et al. . Management of acute promyelocytic leukemia: recommendations from an expert panel on behalf of the European LeukemiaNet. Blood. 2009;113(9): 1875-1891. - PubMed
    1. de Rooij JDE, Branstetter C, Ma J, et al. . Pediatric non-Down syndrome acute megakaryoblastic leukemia is characterized by distinct genomic subsets with varying outcomes. Nat Genet. 2017;49(3):451-456. - PMC - PubMed
    1. Ling T, Birger Y, Stankiewicz MJ, et al. . Chromatin occupancy and epigenetic analysis reveal new insights into the function of the GATA1 N terminus in erythropoiesis. Blood. 2019;134(19):1619-1631. - PMC - PubMed
    1. Li Z, Godinho FJ, Klusmann JH, Garriga-Canut M, Yu C, Orkin SH. Developmental stage-selective effect of somatically mutated leukemogenic transcription factor GATA1. Nat Genet. 2005;37(6):613-619. - PubMed
    1. Wechsler J, Greene M, McDevitt MA, et al. . Acquired mutations in GATA1 in the megakaryoblastic leukemia of Down syndrome. Nat Genet. 2002;32(1):148-152. - PubMed

Publication types