. 2021 Aug 24;10(9):2177.
doi: 10.3390/cells10092177.

A Universal Approach to Analyzing Transmission Electron Microscopy with ImageJ

Affiliations

A Universal Approach to Analyzing Transmission Electron Microscopy with ImageJ

Jacob Lam et al. Cells. .

Abstract

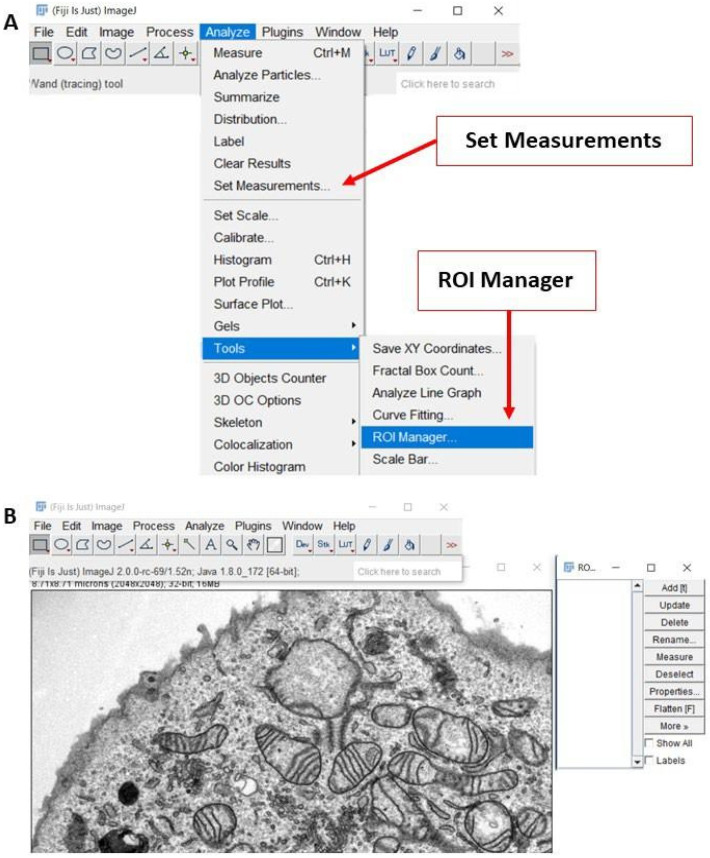
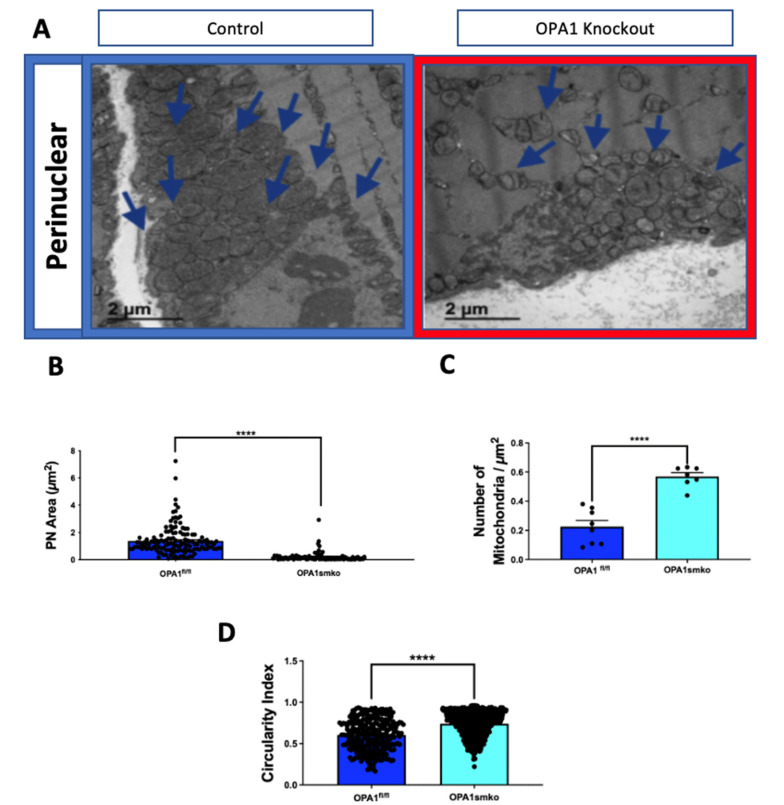
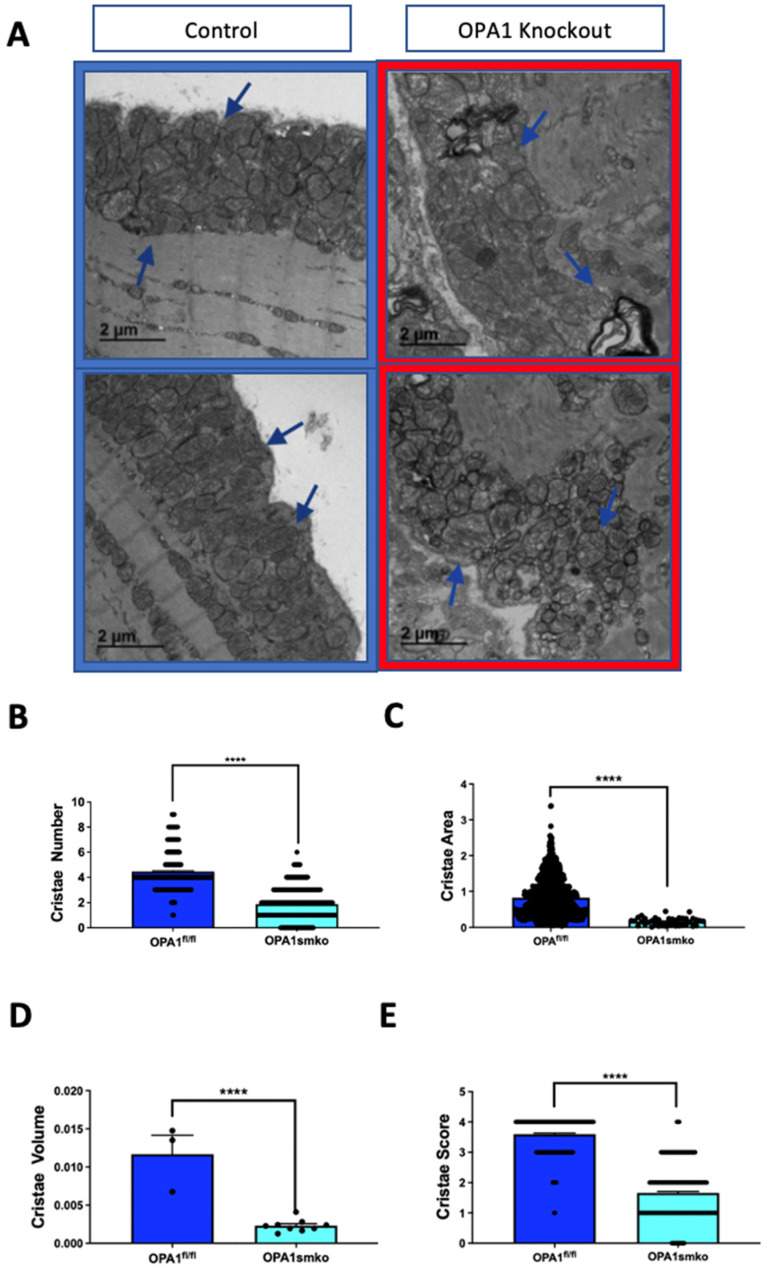
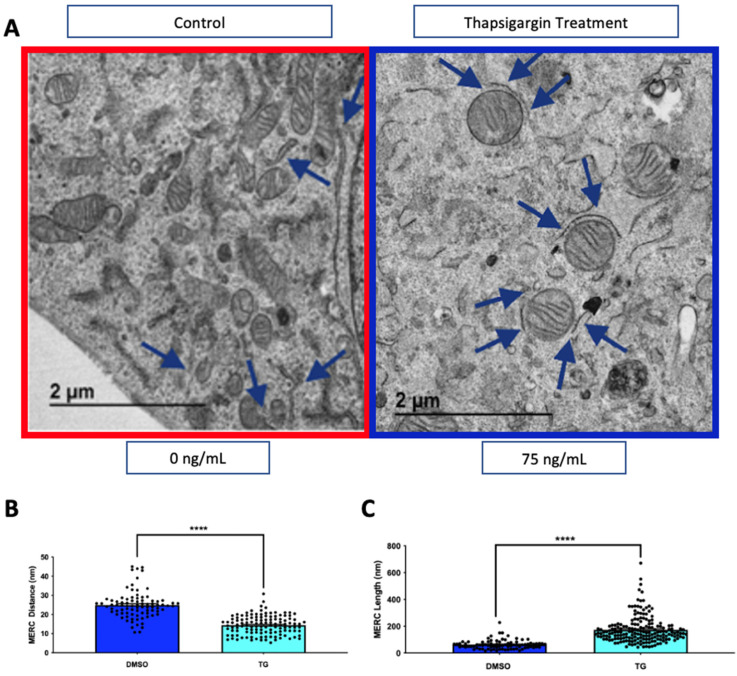
Transmission electron microscopy (TEM) is widely used as an imaging modality to provide high-resolution details of subcellular components within cells and tissues. Mitochondria and endoplasmic reticulum (ER) are organelles of particular interest to those investigating metabolic disorders. A straightforward method for quantifying and characterizing particular aspects of these organelles would be a useful tool. In this protocol, we outline how to accurately assess the morphology of these important subcellular structures using open source software ImageJ, originally developed by the National Institutes of Health (NIH). Specifically, we detail how to obtain mitochondrial length, width, area, and circularity, in addition to assessing cristae morphology and measuring mito/endoplasmic reticulum (ER) interactions. These procedures provide useful tools for quantifying and characterizing key features of sub-cellular morphology, leading to accurate and reproducible measurements and visualizations of mitochondria and ER.

Keywords: ImageJ; Mitochondria Endoplasmic Reticulum Contacts (MERCs); TEM analysis; TEM quantification; cristae; image analysis; image processing; mitochondria.


Conflict of interest statement

The authors declare no conflict of interest.

Figures

Figure 1
Figure 1
Preparing ImageJ software for image analysis. (A) On the ImageJ toolbar, the “Analyze” menu contains many of the settings and tools needed for this analysis method. (B) Representative screenshot of a transmission electron microscopy (TEM) image that is ready to be analyzed. The ROI menu is shown to the right TEM image.
Figure 2
Figure 2
Analyzing organelle morphology with ImageJ. (A) Representative TEM image illustrating how to measure mitochondrial length, width, area, and circularity. (B) Representative TEM image illustrating how to obtain cristae measurements (yellow). (C,D) Representative TEM images illustrating how to determine ER-mitochondria contact length and ER-mitochondria contact distance (yellow).
Figure 3
Figure 3
Knockdown of optic atrophy protein-1 (OPA1) decreases mitochondrial area. (A) Representative TEM images of mitochondria in mouse skeletal muscle tissue from OPA1 knockdown (red outline) and control (blue outline) tissue. (B) Quantification of perinuclear mitochondrial area, (C) number of mitochondria per square micron, and (D) mitochondrial circularity index. Statistical significance is indicated by asterisks; ***** indicate p ≤ 0.0001.
Figure 4
Figure 4
Knockdown of OPA1 disrupts cristae structure. (A) Representative TEM images of cristae in mouse skeletal muscle tissue from OPA1 knockdown (red outline) and control (blue outline) tissue. (B) Quantification of cristae number, (C) cristae area, (D) cristae volume, and (E) cristae score. Statistical significance is indicated by asterisks; **** indicate p ≤ 0.0001.
Figure 5
Figure 5
Thapsigargin treatment increases mitochondria-endoplasmic reticulum contacts (MERCs). (A) Representative TEM images of mouse skeletal myotubes from untreated (DMSO, red outline) and thapsigargin-treated (blue outline) myotubes. MERCs are identified with blue arrows. (B) Quantification of MERC distance and (C) MERC length. Statistical significance is indicated by asterisks, **** indicate p ≤ 0.0001.

References

    1. Brand M., Orr A., Perevoshchikova I., Quinlan C. The role of mitochondrial function and cellular bioenergetics in ageing and disease. Br. J. Dermatol. 2013;169:1–8. doi: 10.1111/bjd.12208. - DOI - PMC - PubMed
    1. Schwarz D.S., Blower M.D. The endoplasmic reticulum: Structure, function and response to cellular signaling. Cell. Mol. Life Sci. 2016;73:79–94. doi: 10.1007/s00018-015-2052-6. - DOI - PMC - PubMed
    1. Bone R., Oyebamiji O., Talware S., Selvaraj S., Krishnan P., Syed F., Wu H., Evans-Molina C. A Computational Approach for Defining a Signature of β-Cell Golgi Stress in Diabetes. Diabetes. 2020;69:2364–2376. doi: 10.2337/db20-0636. - DOI - PMC - PubMed
    1. Wallace D.C. A mitochondrial paradigm of metabolic and degenerative diseases, aging, and cancer: A dawn for evolutionary medicine. Annu. Rev. Genet. 2005;39:359–407. doi: 10.1146/annurev.genet.39.110304.095751. - DOI - PMC - PubMed
    1. Ozcan L., Tabas I. Role of endoplasmic reticulum stress in metabolic disease and other disorders. Annu. Rev. Med. 2012;63:317–328. doi: 10.1146/annurev-med-043010-144749. - DOI - PMC - PubMed

Publication types

LinkOut - more resources