. 2021 Aug 27;10(9):2215.
doi: 10.3390/cells10092215.

Autophagy-Associated IL-15 Production Is Involved in the Pathogenesis of Leprosy Type 1 Reaction

Affiliations

Autophagy-Associated IL-15 Production Is Involved in the Pathogenesis of Leprosy Type 1 Reaction

Bruno Jorge de Andrade Silva et al. Cells. .

Abstract

Leprosy reactional episodes are acute inflammatory events that may occur during the clinical course of the disease. Type 1 reaction (T1R) is associated with an increase in neural damage, and the understanding of the molecular pathways related to T1R onset is pivotal for the development of strategies that may effectively control the reaction. Interferon-gamma (IFN-γ) is a key cytokine associated with T1R onset and is also associated with autophagy induction. Here, we evaluated the modulation of the autophagy pathway in Mycobacterium leprae-stimulated cells in the presence or absence of IFN-γ. We observed that IFN-γ treatment promoted autophagy activation and increased the expression of genes related to the formation of phagosomes, autophagy regulation and function, or lysosomal pathways in M. leprae-stimulated cells. IFN-γ increased interleukin (IL)-15 secretion in M. leprae-stimulated THP-1 cells in a process associated with autophagy activation. We also observed higher IL15 gene expression in multibacillary (MB) patients who later developed T1R during clinical follow-up when compared to MB patients who did not develop the episode. By overlapping gene expression patterns, we observed 13 common elements shared between T1R skin lesion cells and THP-1 cells stimulated with both M. leprae and IFN-γ. Among these genes, the autophagy regulator Translocated Promoter Region, Nuclear Basket Protein (TPR) was significantly increased in T1R cells when compared with non-reactional MB cells. Overall, our results indicate that IFN-γ may induce a TPR-mediated autophagy transcriptional program in M. leprae-stimulated cells similar to that observed in skin cells during T1R by a pathway that involves IL-15 production, suggesting the involvement of this cytokine in the pathogenesis of T1R.

Keywords: IL-15; Mycobacterium leprae; autophagy; leprosy or T1R; lysosomes; macrophage or THP-1; phagosome.


Conflict of interest statement

The authors declare no conflict of interest.

Figures

Figure 1
Figure 1
IFN-γ positively regulated autophagy in monocytes stimulated with M. leprae. (A) Human monocytes were stimulated with M. leprae (MOI 10:1) for 30 min, then treated with 10 ng/mL of IFN-γ for 18 h and processed for analysis by immunofluorescence or transmission electron microscopy. LC3 (green), M. leprae stained with PKH26 (red), and the nucleus stained with DAPI (blue). Red arrows indicate double-membrane (autophagosomes) visible sites; black arrowheads indicate M. leprae-containing autophagosomes; yellow arrowheads indicate M. leprae-containing phagosomes; asterisks indicate M. leprae; M indicates mitochondria; N indicates nucleus. The images are representative of six (fluorescence) or three (TEM) experiments. Scale bar: 20 µm. (B) Quantification of LC3 puncta per cell in the same conditions mentioned above. Data are the mean ± S.E.M; * p < 0.05, ** p < 0.01 by the repeated measures one-way ANOVA with the Geisser–Greenhouse correction and Tukey’s multiple comparisons test. (C) Human THP-1 macrophages were stimulated with M. leprae-PKH26 (green) for 30 min (MOI 10:1) and treated with 10 ng/mL of IFN-γ for 18 h. Atg3 expression was evaluated by immunofluorescence microscopy using anti-Atg3 antibody (red), with the nucleus stained with DAPI (blue). The images are representative of three experiments. Scale bar: 10 µm. Differential interference contrast (DIC). (D) Quantification of Atg3 fluorescence in the same conditions mentioned above. (E) Quantification of the percentage of M. leprae organisms colocalized with Atg3. Data are the mean ± S.E.M; * p < 0.05, *** p < 0.001 by the repeated measures one-way ANOVA with the Geisser–Greenhouse correction and Tukey’s multiple comparisons test (D) or two-tailed paired t-test (E).
Figure 2
Figure 2
Wortmannin blockaded the autophagic flux induced by IFN-γ in THP-1 macrophages stimulated with M. leprae. (A) THP-1 macrophages were pretreated with 100 nM wortmannin for1 h, stimulated with M. leprae PKH26 (red) for 30 min (MOI 10:1), and treated with 10 ng/mL IFN-γ for 18 h. LC3 expression was assessed by immunofluorescence using an anti-LC3 antibody (green), with the nucleus stained with DAPI (white). LysoTracker (blue) was added to the cultures 30 min before fixation. Arrowheads indicate colocalization profiles in at least two channels, which are shown on the insets. Scale bar: 20 µm. (B) Colocalization analysis. The images represent five experiments. Data in whiskers are the minimum to maximum with all points shown; * p < 0.05, ** p < 0.01 by the repeated measures two-way ANOVA with the Geisser-Greenhouse correction and Tukey’s multiple comparisons test.
Figure 3
Figure 3
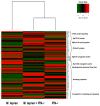
Autophagy gene expression profiles of THP-1 cells stimulated with M. leprae and IFN-γ. mRNAs of THP-1 macrophages treated with M. leprae + IFN-γ, as well as the macrophages treated individually with each stimulus, were analyzed by RT-qPCR using an autophagy pathway array PCR kit. The heatmap shows the analysis of autophagy-related genes aggregated in different categories. Each line is representative of a gene. Data represent three independent experiments.
Figure 4
Figure 4
In the presence of M. leprae, IFN-γ increased the secretion of IL-15 in THP-1 macrophages. THP-1 macrophages were pretreated or not with 10 mM 3-MA for 1 h, stimulated with M. leprae for 30 min (MOI 10:1), and treated with 10 ng/mL of IFN-γ for 18 h. Cytokine production was assessed by ELISA. (A) IL-15, (B) IL-10. The graphs are representative of five experiments. Data are the mean ± S.E.M; * p < 0.05, ** p < 0.01, *** p < 0.001 by the repeated measures one-way ANOVA with the Geisser-Greenhouse correction and Tukey’s multiple comparisons test. ns: not significant.
Figure 5
Figure 5
Cytokine mRNA expression profile in PB, MB, and T1R skin lesions. Gene expression of the inflammatory molecule IL-15 (A) and anti-inflammatory molecule IL-10 (C) were evaluated by real-time PCR in skin lesions of paucibacillary (PB), multibacillary (MB), and reactional (T1R) patients. (B,D) MB patients were monitored for 2 years following the start of MDT and were stratified on the basis of the outcome or not of T1R during the follow-up. (B) IL-15 mRNA levels. (D) IL-10 mRNA levels. Patient data are representative of PB (n = 14), MB no-progression (n = 8), MB progression (n = 7), and T1R (n = 12). Gene expression data were normalized to GAPDH. Data in the whiskers are the minimum to maximum with all points shown; * p < 0.05 by the Brown–Forsythe and Welch ANOVA tests with Dunnett’s T3 multiple comparisons test (A,C) or two-tailed unpaired t-test with Welch’s correction (B,D). ns: not significant.
Figure 6
Figure 6
T1R skin lesions and THP-1 macrophages stimulated with M. leprae and IFN-γ were found to share a common autophagy gene signature. (A) Venn diagram overlap of autophagy gene expression signatures of leprosy skin lesions and THP-1 macrophages stimulated with M. leprae and treated IFN-γ. (B) Tukey box plots displaying normalized log2 gene expression values from microarray data [34] for the 13 genes found in (A). BECN2 was excluded because of microarray annotation issues. Boxes represent first, second (median), and third quartiles with whiskers extending ± 1.5× the interquartile range (IQR). Means were compared using a linear mixed-effects model, allowing for heterogeneous variance among groups, followed by the Tukey multiple comparison procedure. Asterisks summarize Tukey p-values as * p < 0.05, ** p < 0.01, and *** p < 0.001. Tukey confidence intervals are described within results.
Figure 7
Figure 7
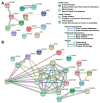
Autophagy protein interaction network between T1R skin lesions and THP-1 macrophages stimulated with M. leprae and IFN-γ. The 13 autophagy proteins codified by the upregulated genes in both T1R patients and treated THP-1 cells were visualized by STRING. (A) The evidence network view showing the 13 shared targets found in this study. In this view, colored lines between proteins indicate the various types of interactions. Network nodes represent proteins. Edges represent protein–protein associations. (B) More proteins were added to the evidence network shown in (A) to show the interaction of the 13 shared targets with core autophagy machinery proteins.

References

    1. Scollard D.M., Martelli C.M., Stefani M.M., de Fatima Maroja M., Villahermosa L., Pardillo F., Tamang K.B. Risk factors for leprosy reactions in three endemic countries. Am. J. Trop. Med. Hyg. 2015;92:108–114. doi: 10.4269/ajtmh.13-0221. - DOI - PMC - PubMed
    1. Lockwood D.N.J., Lucas S.B., Desikan K.V., Ebenezer G., Suneetha S., Nicholls P. The histological diagnosis of leprosy type 1 reactions: Identification of key variables and an analysis of the process of histological diagnosis. J. Clin. Pathol. 2008;61:595–600. doi: 10.1136/jcp.2007.053389. - DOI - PubMed
    1. Naafs B., van Hees C.L.M. Leprosy Type 1 Reaction (Formerly Reversal Reaction) Clin. Dermatol. 2016;34:37–50. doi: 10.1016/j.clindermatol.2015.10.006. - DOI - PubMed
    1. Jih M.H., Kimyai-Asadi A., Levis W.R. Reversal reaction to Hansen’s disease. J. Drugs Dermatol. 2002;1:70–71. - PubMed
    1. Smith W.C., Anderson A.M., Withington S.G., van Brakel W.H., Croft R.P., Nicholls P.G., Richardus J.H. Steroid prophylaxis for prevention of nerve function impairment in leprosy: Randomised placebo controlled trial (TRIPOD 1) BMJ. 2004;328:1459. doi: 10.1136/bmj.38107.645926.AE. - DOI - PMC - PubMed

Publication types

MeSH terms