

Induced Pluripotent Stem Cell-Derived Dopaminergic Neurons from Familial Parkinson's Disease Patients Display α-Synuclein Pathology and Abnormal Mitochondrial Morphology
- PMID: 34572052
- PMCID: PMC8467069
- DOI: 10.3390/cells10092402
Induced Pluripotent Stem Cell-Derived Dopaminergic Neurons from Familial Parkinson's Disease Patients Display α-Synuclein Pathology and Abnormal Mitochondrial Morphology
Abstract
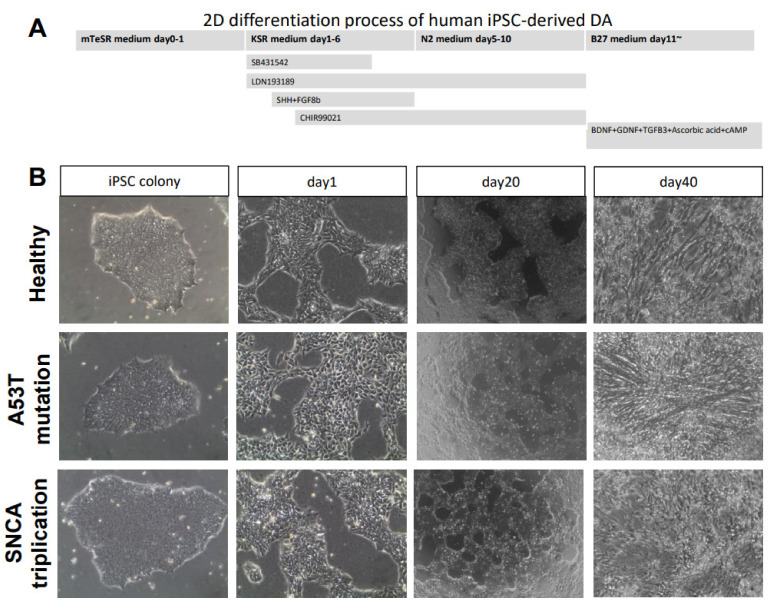
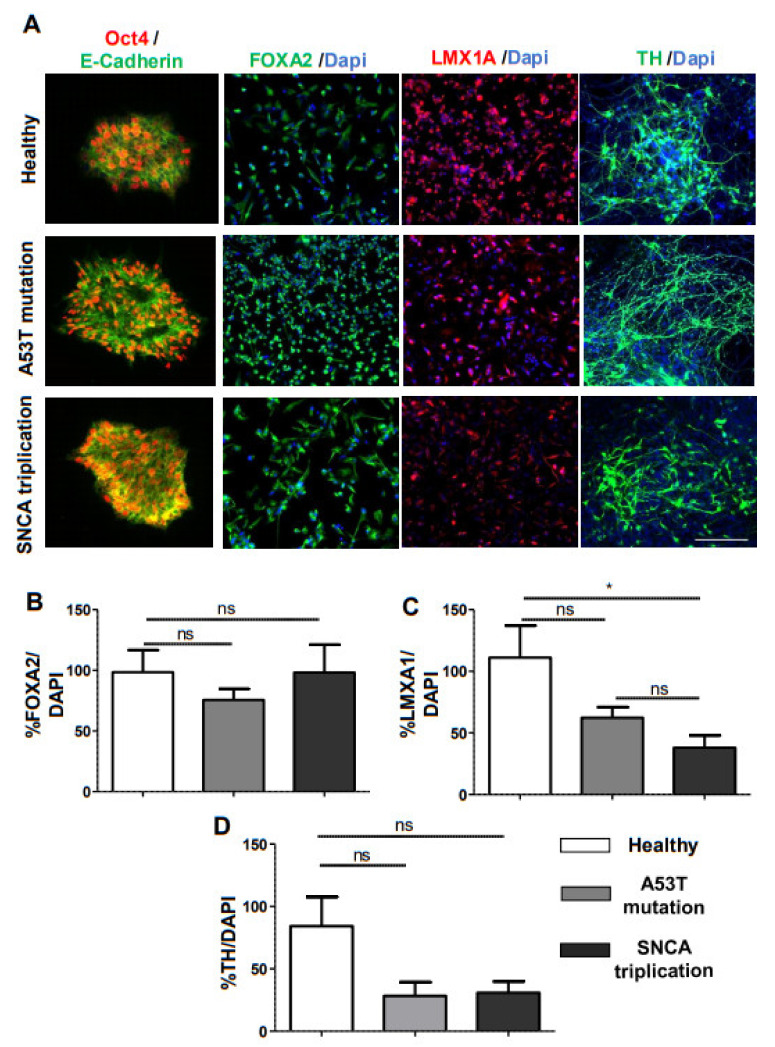
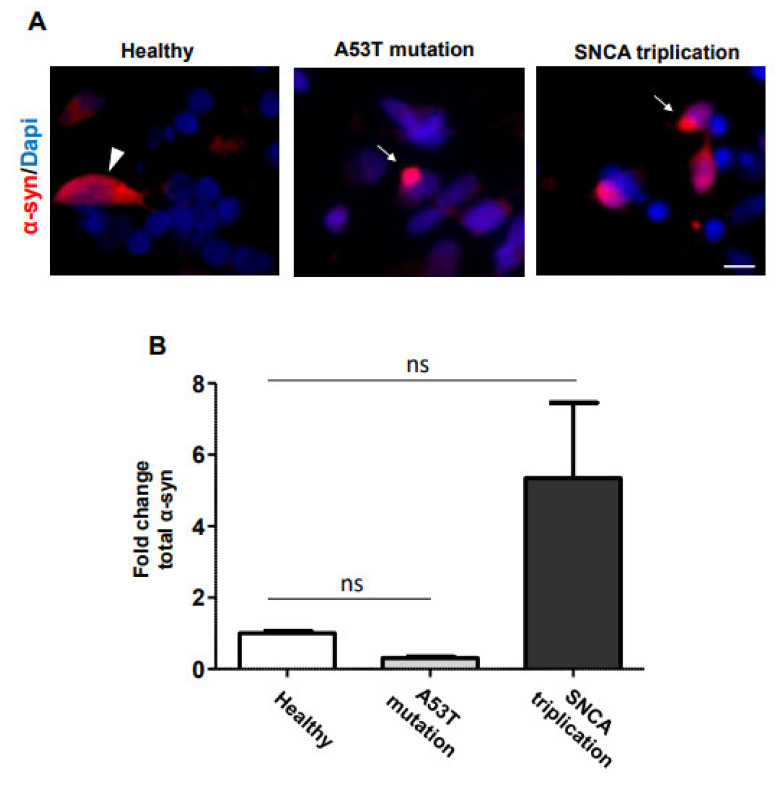
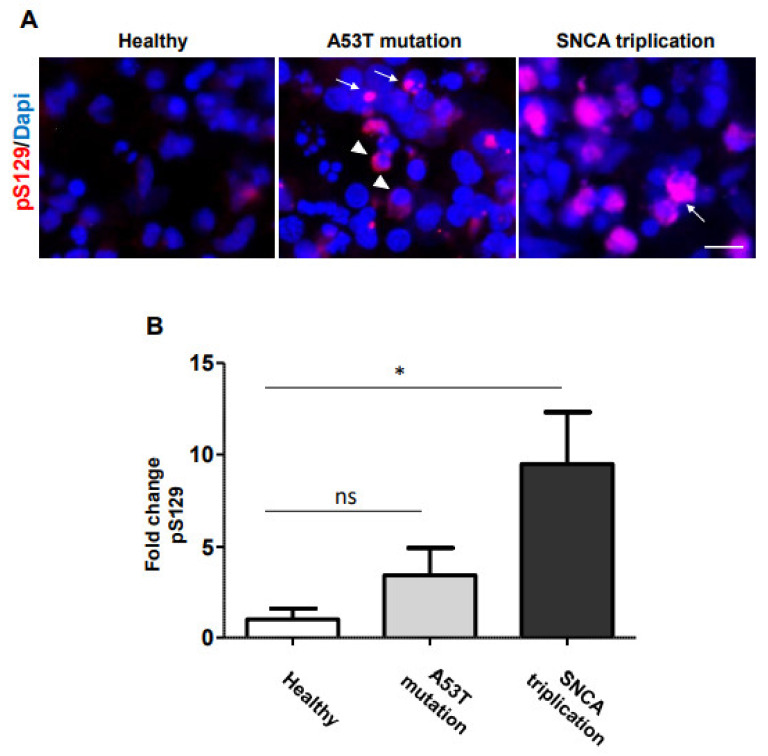
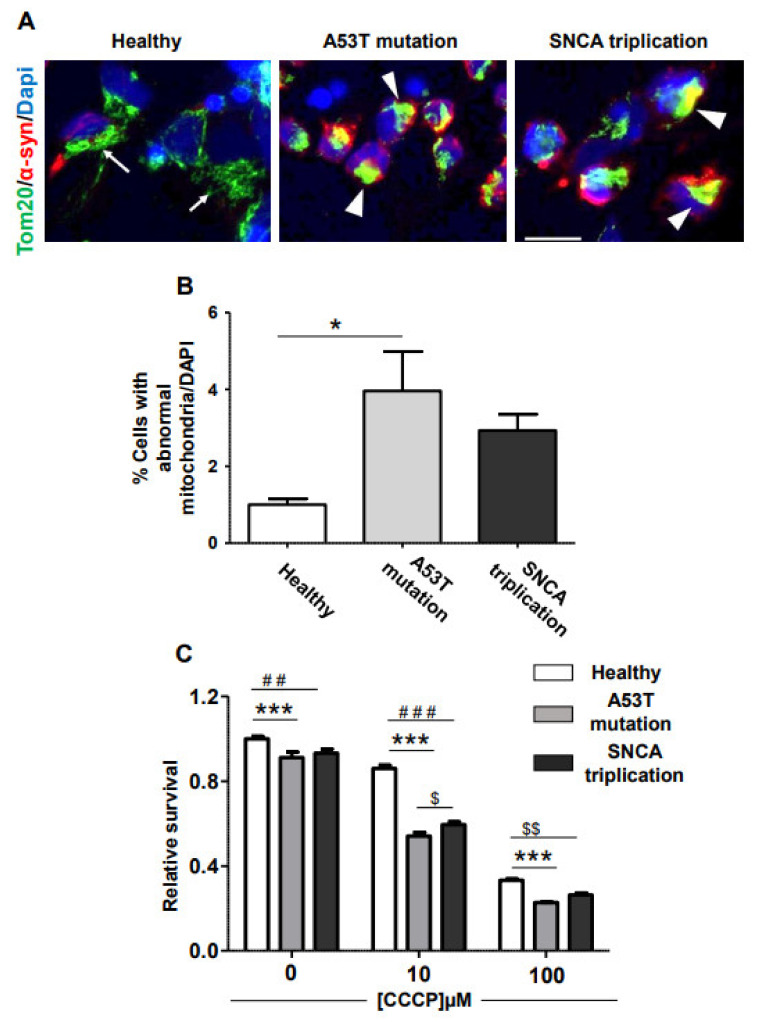
Accumulation of α-synuclein (α-syn) into Lewy bodies (LBs) and mitochondrial abnormalities are the two cardinal pathobiological features of Parkinson's disease (PD), which are associated with the loss of dopaminergic neurons. Although α-syn accumulates in many different cellular and mouse models, these models generally lack LB features. Here, we generated midbrain dopaminergic (mDA) neuronal cultures from induced pluripotent stem cells (iPSCs) derived from familial PD (fPD) patients and healthy controls. We show that mDA neuronal cultures from fPD patients with A53T mutation and α-syn gene (SNCA) triplication display pathological α-syn deposits, which spatially and morphologically resemble LBs. Importantly, we did not find any apparent accumulation of pathological α-syn in mDA neuronal culture derived from a healthy donor. Furthermore, we show that there are morphological abnormalities in the mitochondrial network in mDA neuronal cultures from fPD patients. Consequently, these cells were more susceptible to mitochondrial damage compared with healthy donor-derived mDA neuronal cultures. Our results indicate that the iPSC-derived mDA neuronal culture platform can be used to investigate the spatiotemporal appearance of LBs, as well as their composition, architecture, and relationship with mitochondrial abnormalities.
Keywords: Lewy bodies; Parkinson’s disease; dopaminergic neurons; iPSC; mitochondria; α-synuclein aggregates.
Conflict of interest statement
The authors declare no conflict of interest.
Figures
Similar articles
-
Cellular α-synuclein pathology is associated with bioenergetic dysfunction in Parkinson's iPSC-derived dopamine neurons.Hum Mol Genet. 2019 Jun 15;28(12):2001-2013. doi: 10.1093/hmg/ddz038. Hum Mol Genet. 2019. PMID: 30753527 Free PMC article.
-
Alpha-synuclein dynamics in induced pluripotent stem cell-derived dopaminergic neurons from a Parkinson's disease patient (PARK4) with SNCA triplication.FEBS Open Bio. 2021 Feb;11(2):354-366. doi: 10.1002/2211-5463.13060. Epub 2021 Jan 5. FEBS Open Bio. 2021. PMID: 33301617 Free PMC article.
-
REST Protects Dopaminergic Neurons from Mitochondrial and α-Synuclein Oligomer Pathology in an Alpha Synuclein Overexpressing BAC-Transgenic Mouse Model.J Neurosci. 2021 Apr 21;41(16):3731-3746. doi: 10.1523/JNEUROSCI.1478-20.2021. Epub 2021 Feb 9. J Neurosci. 2021. PMID: 33563726 Free PMC article.
-
Reprint of: revisiting oxidative stress and mitochondrial dysfunction in the pathogenesis of Parkinson disease-resemblance to the effect of amphetamine drugs of abuse.Free Radic Biol Med. 2013 Sep;62:186-201. doi: 10.1016/j.freeradbiomed.2013.05.042. Epub 2013 Jun 3. Free Radic Biol Med. 2013. PMID: 23743292 Review.
-
The Overcrowded Crossroads: Mitochondria, Alpha-Synuclein, and the Endo-Lysosomal System Interaction in Parkinson's Disease.Int J Mol Sci. 2019 Oct 25;20(21):5312. doi: 10.3390/ijms20215312. Int J Mol Sci. 2019. PMID: 31731450 Free PMC article. Review.
Cited by
-
Role of Mitochondrial Dysfunctions in Neurodegenerative Disorders: Advances in Mitochondrial Biology.Mol Neurobiol. 2025 Jun;62(6):6827-6855. doi: 10.1007/s12035-024-04469-x. Epub 2024 Sep 13. Mol Neurobiol. 2025. PMID: 39269547 Review.
-
Alpha-synuclein in mitochondrial dysfunction: opportunities or obstacles.Neural Regen Res. 2025 Jan 1;20(1):197-198. doi: 10.4103/NRR.NRR-D-23-01966. Epub 2024 Apr 3. Neural Regen Res. 2025. PMID: 39657088 Free PMC article. No abstract available.
-
Identification of DOT1L inhibitor in a screen for factors that promote dopaminergic neuron survival.Front Aging Neurosci. 2022 Dec 12;14:1026468. doi: 10.3389/fnagi.2022.1026468. eCollection 2022. Front Aging Neurosci. 2022. PMID: 36578445 Free PMC article.
-
Induced pluripotent stem cells: a tool for modeling Parkinson's disease.Trends Neurosci. 2022 Aug;45(8):608-620. doi: 10.1016/j.tins.2022.05.001. Epub 2022 Jun 3. Trends Neurosci. 2022. PMID: 35667922 Free PMC article. Review.
-
High Content Analysis of Mitochondrial Function in Induced Pluripotent Stem Cell-Derived Neurons.Methods Mol Biol. 2025;2924:259-268. doi: 10.1007/978-1-0716-4530-7_19. Methods Mol Biol. 2025. PMID: 40307649
References
Publication types
MeSH terms
Substances
LinkOut - more resources
Full Text Sources
Medical
Research Materials
Miscellaneous
