. 2021 Sep 16;10(9):2439.
doi: 10.3390/cells10092439.

Sexually Dimorphic Transcriptomic Changes of Developing Fetal Brain Reveal Signaling Pathways and Marker Genes of Brain Cells in Domestic Pigs

Affiliations

Sexually Dimorphic Transcriptomic Changes of Developing Fetal Brain Reveal Signaling Pathways and Marker Genes of Brain Cells in Domestic Pigs

Monica Strawn et al. Cells. .

Abstract

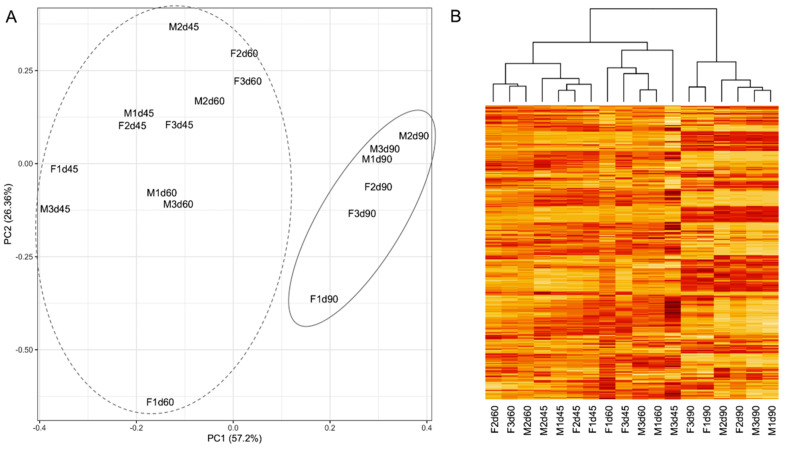
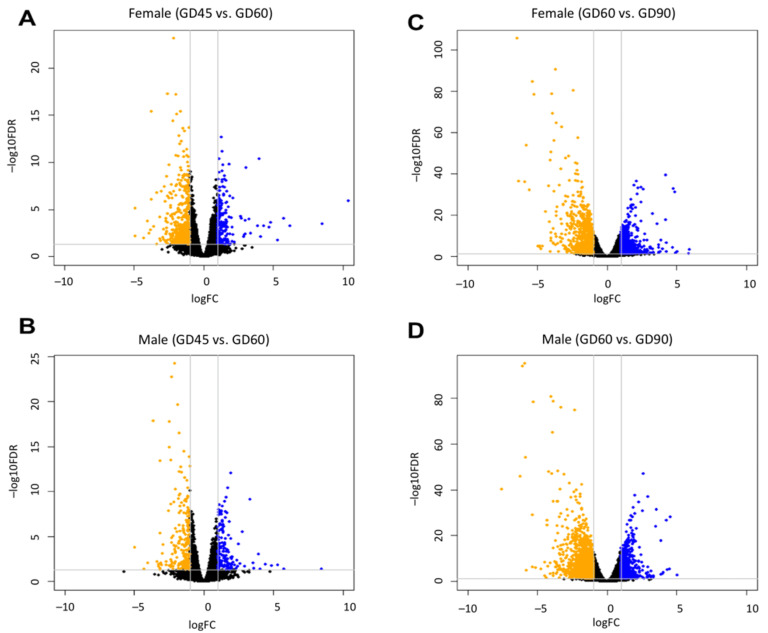
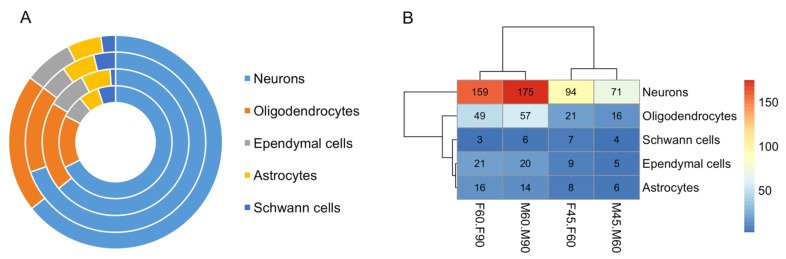
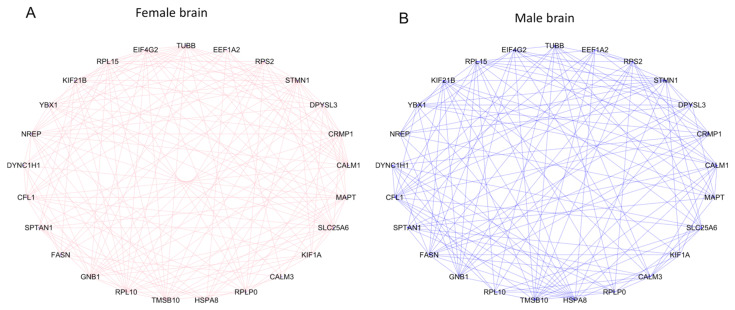
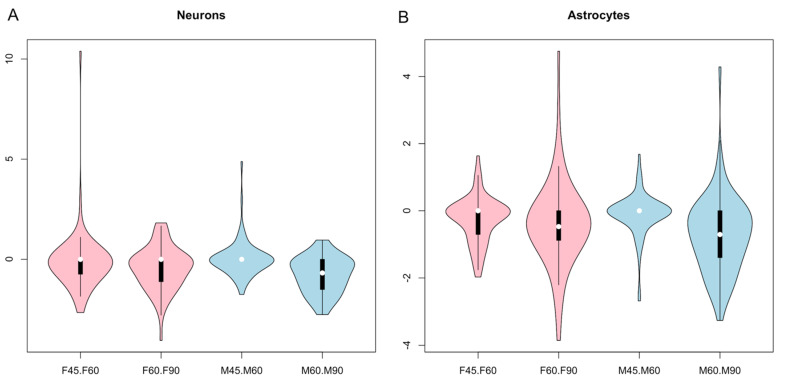
In this study, transcriptomic changes of the developing brain of pig fetuses of both sexes were investigated on gestation days (GD) 45, 60 and 90. Pig fetal brain grows rapidly around GD60. Consequently, gene expression of the fetal brain was distinctly different on GD90 compared to that of GD45 and GD60. In addition, varying numbers of differentially expressed genes (DEGs) were identified in the male brain compared to the female brain during development. The sex of adjacent fetuses also influenced gene expression of the fetal brain. Extensive changes in gene expression at the exon-level were observed during brain development. Pathway enrichment analysis showed that the ionotropic glutamate receptor pathway and p53 pathway were enriched in the female brain, whereas specific receptor-mediated signaling pathways were enriched in the male brain. Marker genes of neurons and astrocytes were significantly differentially expressed between male and female brains during development. Furthermore, comparative analysis of gene expression patterns between fetal brain and placenta suggested that genes related to ion transportation may play a key role in the regulation of the brain-placental axis in pig. Collectively, the study suggests potential application of pig models to better understand influence of fetal sex on brain development.

Keywords: brain development; fetal sex; gene regulation; placenta; swine.


Conflict of interest statement

The authors declare no conflict of interest.

Figures

Figure 1
Figure 1
(A) Principal component analysis of gene expression variation of male (M) and female (F) fetal brains on GDs 45, 60 and 90. The dotted ellipse shows the group representing gene expression of fetal brain on GDs 45 and 60, and the solid ellipse shows the group representing gene expression of fetal brain on GD 90. (B) Heatmap of expression of genes in fetal brain samples also shows that GD 90 samples cluster differently than the samples of GDs 45 and 60.
Figure 2
Figure 2
Box plots of covariates showing canonically correlated expression clusters between male brain (A) and female brain (B). The x-axis shows expression clusters (1–10) and y-axis shows covariates of canonical correlation. The mean value of expression cluster is shown by horizontal line inside each box. The lower and upper quartile values of covariates are shown for each cluster.
Figure 3
Figure 3
Volcano plots showing differential expression of genes in female fetal brain between GDs 45 vs. 60 (A), male fetal brain between GDs 45 vs. 60 (B), female fetal brain between GDs 60 vs. 90 (C), and male fetal brain between GDs 60 vs. 90 (D). In each plot, the y-axis shows the –log10(FDR) values and x-axis shows log fold change values. The orange color shows genes that are downregulated, and blue color shows genes that are upregulated between the two groups in each plot. The horizontal line above value 0 in y-axis represents FDR value of 0.05 used to identify significance of differential expression of genes.
Figure 4
Figure 4
(A) Donut plot showing proportion of marker genes representing different brain cells (color coded). The four circles in this donut plot represent the samples in which the marker genes were significantly differentially expressed. From the center to outward direction, these circles represent DE genes between brain samples of F45 vs. F60, F60 vs. F90, M45 vs. M60, and M60 vs. M90, respectively. F and M represent female and male respectively whereas the numbers represent GDs. (B) Heatmap showing the number marker genes associated with different cell types of the brain (shown in rows) and GDs during which those genes are significantly differentially expressed in the male and female fetal brain (shown in columns). The cluster patterns of rows and columns are shown along with color scale (in the right). The scale represents the number of DE marker genes of brain cells.
Figure 5
Figure 5
Network plot of genes based on mutation information of expression changes during development of female fetal brain (A) and male fetal brain (B). The lines (edges) connecting the nodes show how a gene is transcriptionally interconnected with other genes. They are colored pink in female brain and blue in male brain.
Figure 6
Figure 6
Violin plots of e×pression of marker genes specific to neurons (A) and astrocytes (B) of male (light blue) and female brain (pink) developing during GD45 to GD60 and GD60 to GD90. In both plots, the values in y-a×is represent the log fold changes of gene e×pression. The ×-a×is shows the sample comparisons.

Similar articles

Cited by

References

    1. Monteagudo A., Timor-Tritsch I.E. Normal sonographic development of the central nervous system from the second trimester onwards using 2D, 3D and transvaginal sonography. Prenat. Diagn. 2008;29:326–339. doi: 10.1002/pd.2146. - DOI - PubMed
    1. Nowakowski R.S., Hayes N.L. CNS development: An overview. Dev. Psychopathol. 1999;11:395–417. doi: 10.1017/S0954579499002126. - DOI - PubMed
    1. Semple B.D., Blomgren K., Gimlin K., Ferriero D.M., Noble-Haeusslein L.J. Brain development in rodents and humans: Identifying benchmarks of maturation and vulnerability to injury across species. Prog. Neurobiol. 2013;106-107:1–16. doi: 10.1016/j.pneurobio.2013.04.001. - DOI - PMC - PubMed
    1. Dickerson J.W., Dobbing J. Prenatal and postnatal growth and development of the central nervous system of the pig. Proc. R. Soc. London. Ser. B: Boil. Sci. 1967;166:384–395. doi: 10.1098/rspb.1967.0002. - DOI - PubMed
    1. Conrad M.S., Dilger R.N., Johnson R.W. Brain Growth of the Domestic Pig (Sus scrofa) from 2 to 24 Weeks of Age: A Longitudinal MRI Study. Dev. Neurosci. 2012;34:291–298. doi: 10.1159/000339311. - DOI - PMC - PubMed

Publication types