. 2021 Aug 30;9(9):1119.
doi: 10.3390/biomedicines9091119.

Targeted Inhibition of Anti-Inflammatory Regulator Nrf2 Results in Breast Cancer Retardation In Vitro and In Vivo

Affiliations

Targeted Inhibition of Anti-Inflammatory Regulator Nrf2 Results in Breast Cancer Retardation In Vitro and In Vivo

Venugopal R Bovilla et al. Biomedicines. .

Abstract

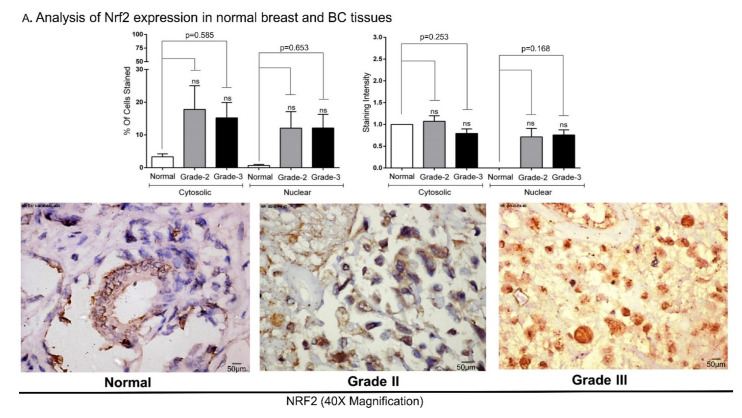
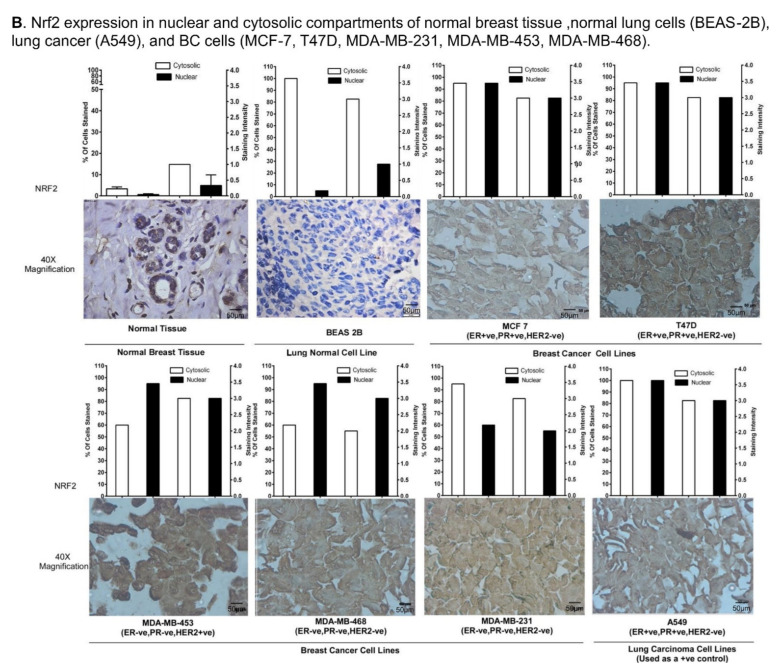
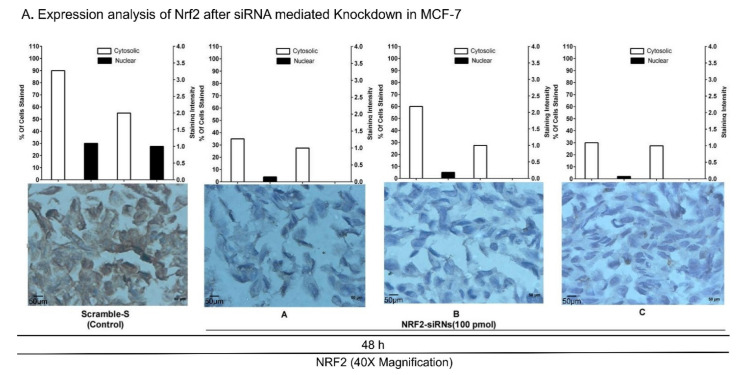
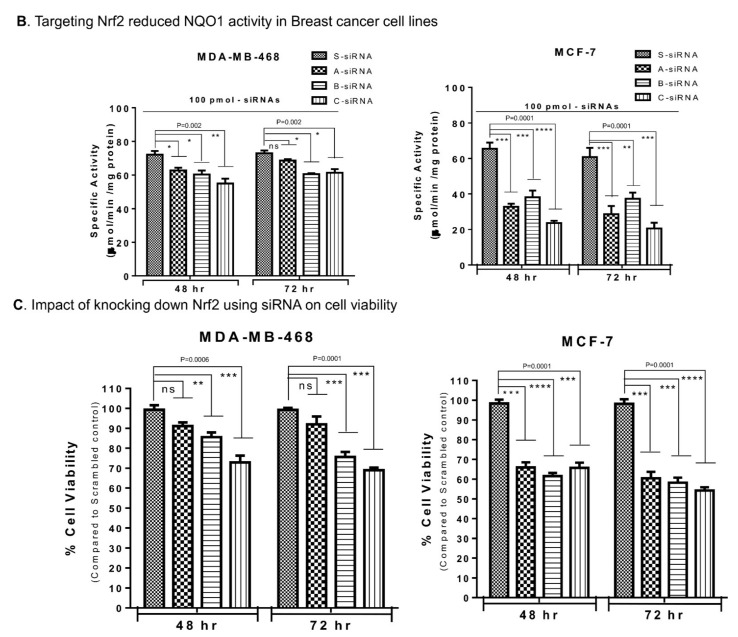
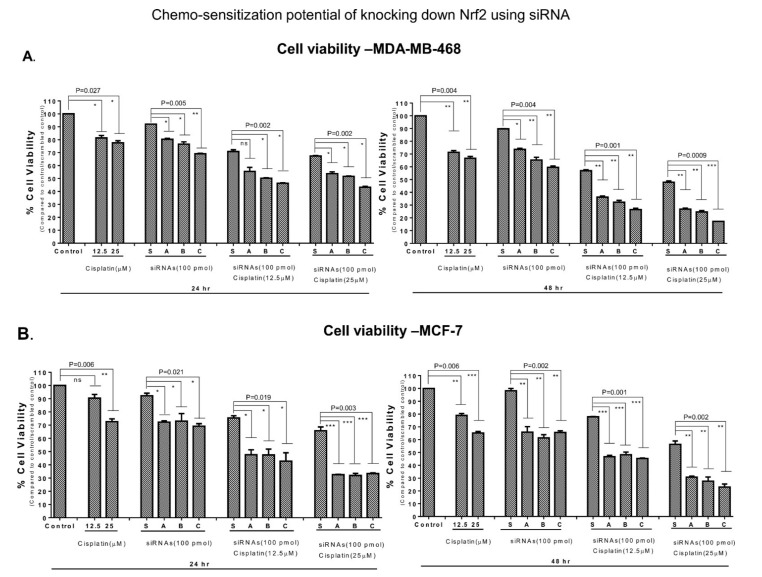
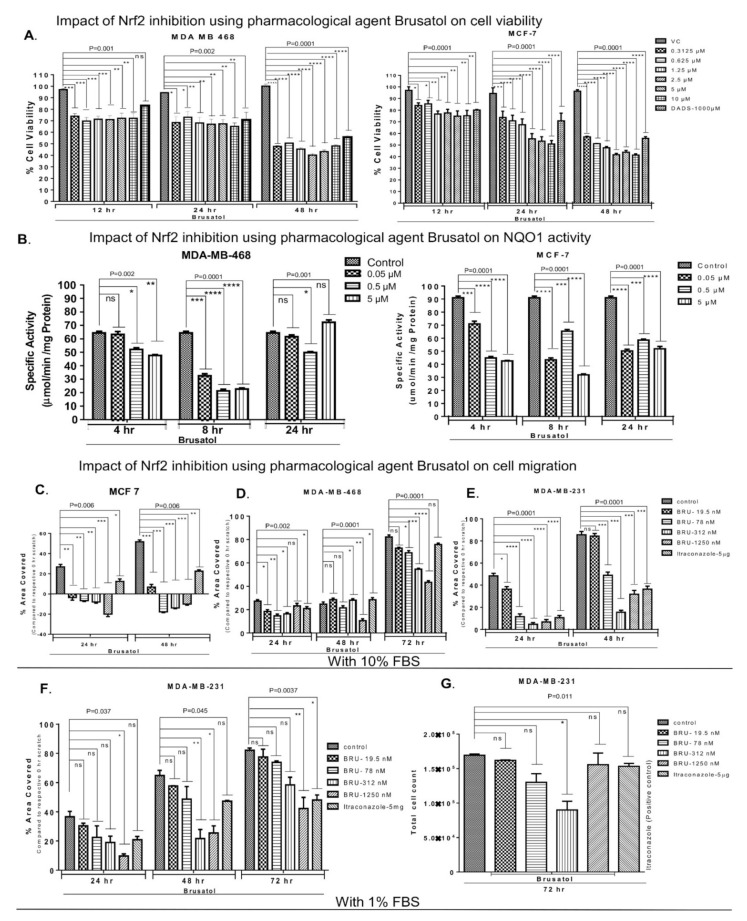
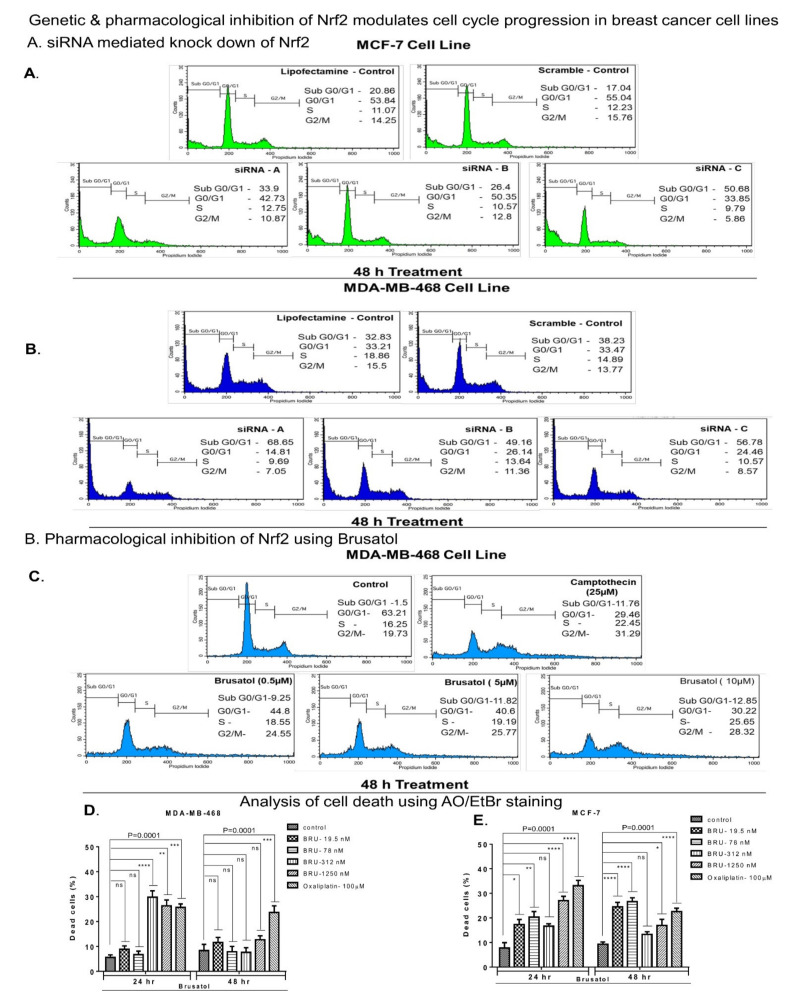
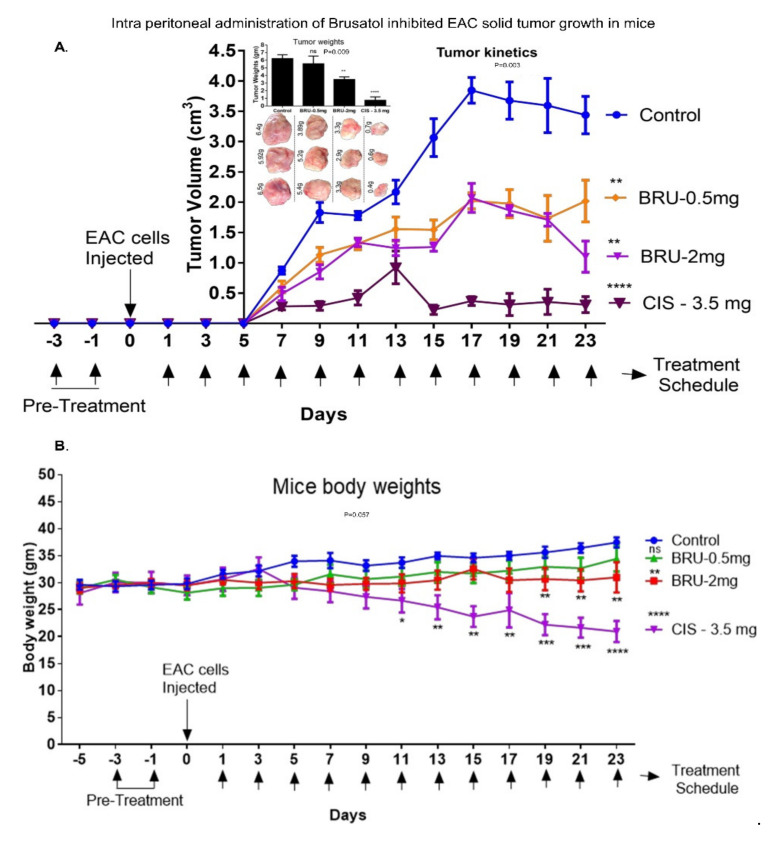
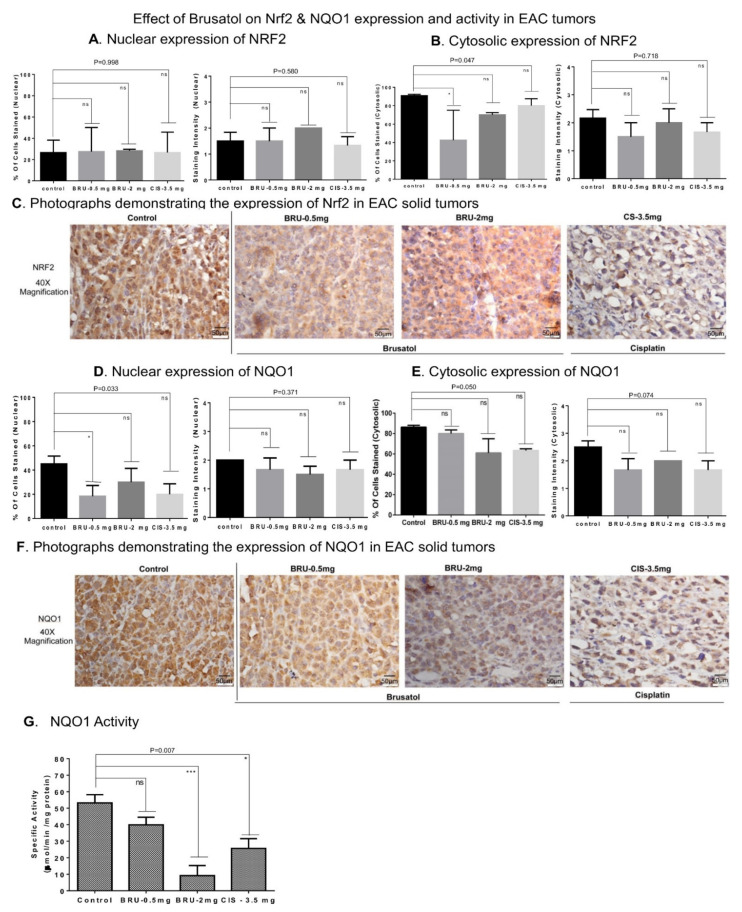
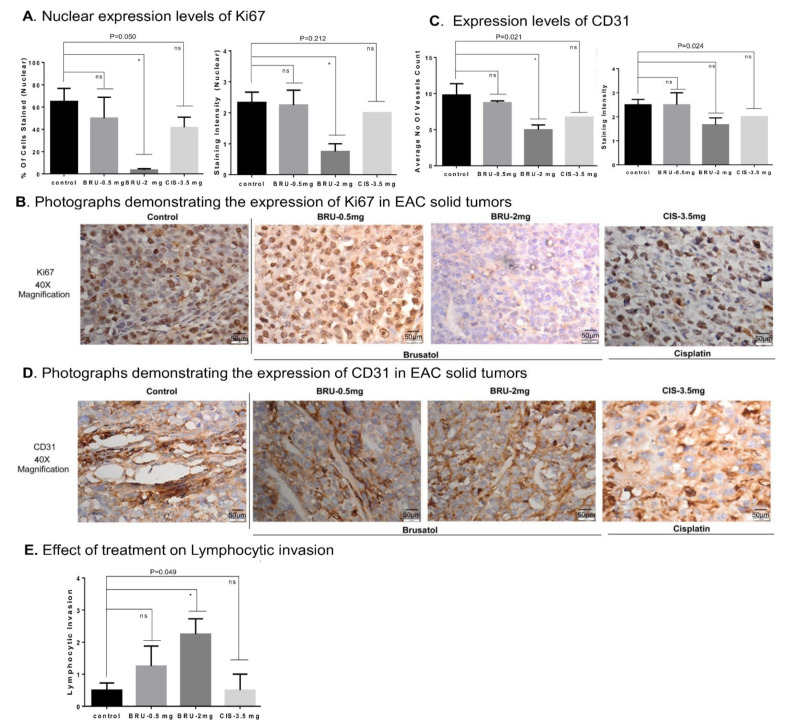
Nuclear factor erythroid-2 related factor-2 (Nrf2) is an oxidative stress-response transcriptional activator that promotes carcinogenesis through metabolic reprogramming, tumor promoting inflammation, and therapeutic resistance. However, the extension of Nrf2 expression and its involvement in regulation of breast cancer (BC) responses to chemotherapy remain largely unclear. This study determined the expression of Nrf2 in BC tissues (n = 46) and cell lines (MDA-MB-453, MCF-7, MDA-MB-231, MDA-MB-468) with diverse phenotypes. Immunohistochemical (IHC)analysis indicated lower Nrf2 expression in normal breast tissues, compared to BC samples, although the difference was not found to be significant. However, pharmacological inhibition and siRNA-induced downregulation of Nrf2 were marked by decreased activity of NADPH quinone oxidoreductase 1 (NQO1), a direct target of Nrf2. Silenced or inhibited Nrf2 signaling resulted in reduced BC proliferation and migration, cell cycle arrest, activation of apoptosis, and sensitization of BC cells to cisplatin in vitro. Ehrlich Ascites Carcinoma (EAC) cells demonstrated elevated levels of Nrf2 and were further tested in experimental mouse models in vivo. Intraperitoneal administration of pharmacological Nrf2 inhibitor brusatol slowed tumor cell growth. Brusatol increased lymphocyte trafficking towards engrafted tumor tissue in vivo, suggesting activation of anti-cancer effects in tumor microenvironment. Further large-scale BC testing is needed to confirm Nrf2 marker and therapeutic capacities for chemo sensitization in drug resistant and advanced tumors.

Keywords: Ehrlich Ascites Carcinoma cells; Nrf2; breast cancer; brusatol; chemo sensitization; tumorigenesis.


Conflict of interest statement

The authors declare no conflict of interest.

Figures

Figure 1
Figure 1
IHC analysis of Nrf2 expression in BC tissues and cell lines: (A) Nrf2 expression in normal and grade-II/III BC tissues: The expression of Nrf2 in normal breast tissues (n = 3), grade-II (n = 14), and grade-III (n = 29) BC tissues was analyzed by IHC. Representative microphotographs (40X magnification images) are shown. Please refer to Supplementary Figure S1 for the tissue array preparation procedure. Expression of Nrf2 in cytosolic and nuclear compartments of the same cells/tissues was compared and was not found significantly different. (B) Elevated Nrf2 was observed in breast cancer cell lines MCF-7, T47D, MDA-MB-453, MDA-MB-231, MDA-MB-468, and in lung cancer cell line A549. Expression of Nrf2 was visualized using immunocytochemistry (IHC). Irrespective of ER, PR, and HER2 expression status, all BC cell lines and A549 exhibited higher level of Nrf2 compared to normal breast tissue and lung cells. Total cell number was counted for each image. Representative microphotographs (40X magnification, Scale:50 µm) are shown. ns refers to non-significant.
Figure 1
Figure 1
IHC analysis of Nrf2 expression in BC tissues and cell lines: (A) Nrf2 expression in normal and grade-II/III BC tissues: The expression of Nrf2 in normal breast tissues (n = 3), grade-II (n = 14), and grade-III (n = 29) BC tissues was analyzed by IHC. Representative microphotographs (40X magnification images) are shown. Please refer to Supplementary Figure S1 for the tissue array preparation procedure. Expression of Nrf2 in cytosolic and nuclear compartments of the same cells/tissues was compared and was not found significantly different. (B) Elevated Nrf2 was observed in breast cancer cell lines MCF-7, T47D, MDA-MB-453, MDA-MB-231, MDA-MB-468, and in lung cancer cell line A549. Expression of Nrf2 was visualized using immunocytochemistry (IHC). Irrespective of ER, PR, and HER2 expression status, all BC cell lines and A549 exhibited higher level of Nrf2 compared to normal breast tissue and lung cells. Total cell number was counted for each image. Representative microphotographs (40X magnification, Scale:50 µm) are shown. ns refers to non-significant.
Figure 2
Figure 2
Targeted inhibition of Nrf2 using siRNA in BC cell lines in vitro: (A) Nrf2 level was reduced in MCF-7 cells transfected with scrambled siRNA (Control) and three different siRNAs (siNrf2-A, siNrf2-B, and siNrf2-C) (Supplementary Table S2 shows siRNA sequences). Representative images of immunocytochemistry (ICC) slides are shown (40× magnification, Scale: 50 µm). (B) Reduced NQO1 activity was observed in MDA-MB-468 and MCF-7 cells (p value = 0.002; p value = 0.0001) with silenced Nrf2. Data were analyzed using one-way ANOVA. (C) Cell viability was determined in MDA-MB-468 and MCF-7 cells using MTS 48 and 72 h after siRNA transfection. A significant reduction in cell growth was observed with siRNA-B and siRNA-C in MDA-MB-468 cell line (p value = 0.0006; p value = 0.0006). In MCF-7 all the three siRNAs yielded significant inhibition of viability (p value = 0.0001; p value = 0.0001) (* p < 0.05, ** p < 0.01, *** p < 0.005, **** p < 0.001). ns refers to non-significant.
Figure 2
Figure 2
Targeted inhibition of Nrf2 using siRNA in BC cell lines in vitro: (A) Nrf2 level was reduced in MCF-7 cells transfected with scrambled siRNA (Control) and three different siRNAs (siNrf2-A, siNrf2-B, and siNrf2-C) (Supplementary Table S2 shows siRNA sequences). Representative images of immunocytochemistry (ICC) slides are shown (40× magnification, Scale: 50 µm). (B) Reduced NQO1 activity was observed in MDA-MB-468 and MCF-7 cells (p value = 0.002; p value = 0.0001) with silenced Nrf2. Data were analyzed using one-way ANOVA. (C) Cell viability was determined in MDA-MB-468 and MCF-7 cells using MTS 48 and 72 h after siRNA transfection. A significant reduction in cell growth was observed with siRNA-B and siRNA-C in MDA-MB-468 cell line (p value = 0.0006; p value = 0.0006). In MCF-7 all the three siRNAs yielded significant inhibition of viability (p value = 0.0001; p value = 0.0001) (* p < 0.05, ** p < 0.01, *** p < 0.005, **** p < 0.001). ns refers to non-significant.
Figure 3
Figure 3
Nrf2 downregulation sensitized BC cells to chemotherapy drug cisplatin: (A) Nrf2 downregulation resulted in inhibition of MDA-MB-468 cells viability. Significant decrease in cell viability was observed for combined Nrf2 knockdown (siNrf2-A, siNrf2-B, and siNrf2-C) and cisplatin treatment (24 h treatment; p value = 0.002; 48 h of treatment; p value = 0.0009). (B) Similar effects were observed in MCF-7 cells (24 h treatment; p value = 0.003; 48 h of treatment; p value = 0.002). One-way ANOVA test was used for the data analysis (* p < 0.05, ** p < 0.01, *** p < 0.005). ns refers to non-significant.
Figure 4
Figure 4
Pharmacological inhibition of Nrf2 using brusatol retarded BC cells proliferation and NQO1 activity in vitro: (A) cell viability was measured using SRB assay. Brusatol (concentration range from 0.3125 to 10 µM) was used as chemical inhibitor of Nrf2 [37,70]. MDA-MB-468 and MCF-7 cells were exposed to increasing concentrations of brusatol for 12, 24, and 48 h. The growth inhibition was time-dependent (p value = 0.0001; p value = 0.0001). Brusatol-induced growth inhibitory effects were compared with those in vehicle treated cells. DADS (1 mM) was used as positive control (B) NQO1 activity was assessed in MDA-MB-468 and MCF-7 cells treated with vehicle control or different concentrations of brusatol (0.05–5 µM). (CG) Nrf2 inhibition by brusatol retards BC cell migration: Cells migration was assessed using a scratch assay. All cell lines were treated with non-toxic concentrations of brusatol (19.5 nM to 1250 nM) or vehicle control. (CE) MCF-7, MDA-MB-468, and MDA-MB-231 cells were grown in media supplemented with 10% FBS. The inhibitory impact of brusatol treatment was the strongest in MCF-7 cells. (F) MDA-MB-231 were grown in 1% FBS. Brusatol treatment significantly decreased the percentage area covered by migrating cells. Itraconazole (5.0 µg/mL) was used as a positive control for inhibiting cell migration [61]. (G) Cell count was found similar in vehicle- and brusatol-treated wells. One-way ANOVA test was used for the data analysis (* p < 0.05, ** p < 0.01, *** p < 0.005, **** p < 0.001). ns refers to non-significant.
Figure 5
Figure 5
Inhibition of Nrf2 using siRNA and brusatol induced cell cycle arrest and promoted cell death in vitro: (A,B) cell cycle progression was measured using PI staining followed by FACS analysis of the stained cells. A significant increase in sub-G0-G1 cell population was detected in MCF-7 (A) and MDA-MB-468 (B) cells transfected with siRNAs targeting Nrf2. (CE) Cell cycle using PI staining followed by analysis of stained cells using FACS (C) and apoptosis (D,E) were measured using AO/EB dual staining. Treatment with brusatol (0.5, 5.0, and 10.0 µM) arrested MDA-MB-468 cells (C) in G2/M phase and increased sub-G0-G1 cell population. A significant increase in the number of dead cells was observed in brusatol treated (19.5 nM to 1250 nM) MDA-MB-468 cells (D) p value = 0.0001) and MCF 7 cells (E) p value = 0.0001). One-way ANOVA test was used for the data analysis (* p < 0.05, ** p < 0.01, *** p < 0.005, **** p < 0.001). ns refers to non-significant.
Figure 6
Figure 6
Intraperitoneal administration of Brusatol retarded EAC solid tumor growth in vivo. Swiss albino mice were engrafted with Nrf2 expressing EAC cells and treated with two different doses of brusatol (0.5 mg/kg and 2.0 mg/kg). (A) Brusatol (2.0 mg/kg) treatment decreased tumor growth significantly (p value = 0.003; at day 23). Cisplatin (3.5 mg/kg) reduced tumor volume and tumor weight effectively. (B) Brusatol (0.5 mg/kg) administration did not induce significant changes in body weight (p value = 0.05), although application of higher brusatol dose (2 mg/kg) resulted in decreased body mass after 17-day treatment. Cisplatin induced significant decreases in body mass after 12th day treatment (p value = 0.01). One-way ANOVA test was used for the data analysis (* p < 0.05, ** p < 0.01, *** p < 0.005, **** p < 0.001). ns refers to non-significant.
Figure 7
Figure 7
Effects of brusatol and cisplatin on Nrf2 and NQO1 expression and activity in EAC tumors ex vivo. (A) IHC staining analysis of Nrf2 expression and localization in engrafted EAC tumor tissues. Brusatol administration did not change the nuclear expression of Nrf2 (a; p value = 0.998; p value = 0.580). (B) Brusatol (0.5 mg/kg) induced a significant decrease in the number of cells with cytosolic Nrf2 expression (left panel; p value = 0.047). (C) Representative IHC microphotographs of Nrf2 stained tumor tissues are shown (Scale: 50 µm). (D) Brusatol (0.5 mg/kg) induced a significant decrease in number of cells expressing nuclear NQO1 (left panel; p value = 0.033). (E) The cytosolic expression of NQO1 was assessed in EAC tumors treated with brusatol and cisplatin (p value = 0.050 vs. control). No significant changes were observed in NQO1 staining intensity. (F) Representative IHC microphotographs of NQO1 stained tumor tissues are shown (Scale: 50 µm). (G) Brusatol (2 mg/kg) stimulated a significant decrease in NQO1 activity in the tumor lysates (p value = 0.007). The positive control cisplatin also reduced NQO1 activity. One-way ANOVA test was used for the data analysis ( * p < 0.05, *** p < 0.005). ns refers to non-significant.
Figure 8
Figure 8
Brusatol reduced CD31 and Ki67 expression in grafted EAC tumor tissues and promoted lymphocytic invasion in vivo. (A,B) Ki67 staining/IHC was used to assess proliferation of grafted EAC [75]. Slides were scored and percentage of Ki67 positive cells was calculated per image. Administration of 2.0 mg/kg brusatol reduced nuclear expression of Ki67 (p value = 0.050; p value = 0.212). (B) Representative IHC microphotographs of Ki67 stained tumor tissues are shown (Scale: 50 µm). (C,D) Tumor angiogenesis was assessed using CD31 staining/IHC. Brusatol treatment reduced level of angiogenesis in vivo (p value = 0.021; p value = 0.024). (E) Brusatol promoted lymphocytic invasion (p value = 0.049). Cisplatin had minimal effects on expression of Ki67 and CDE31 (a and c). (D) Representative IHC microphotographs of CD31 stained EAC tumor tissues are shown (Scale: 50 µm). One-way ANOVA test was used for the data analysis (* p < 0.05). ns refers to non-significant.

References

    1. DeSantis C.E., Ma J., Gaudet M.M., Newman L.A., Miller K.D., Goding Sauer A., Jemal A., Siegel R.L. Breast cancer statistics, 2019. CA Cancer J. Clin. 2019;69:438–451. doi: 10.3322/caac.21583. - DOI - PubMed
    1. Bayraktar S., Batoo S., Okuno S., Gluck S. Immunotherapy in breast cancer. J. Carcinog. 2019;18:2. doi: 10.4103/jcar.JCar_2_19. - DOI - PMC - PubMed
    1. Masoud V., Pages G. Targeted therapies in breast cancer: New challenges to fight against resistance. World J. Clin. Oncol. 2017;8:120–134. doi: 10.5306/wjco.v8.i2.120. - DOI - PMC - PubMed
    1. Yoo B., Fuchs B.C., Medarova Z. New Directions in the Study and Treatment of Metastatic Cancer. Front. Oncol. 2018;8:258. doi: 10.3389/fonc.2018.00258. - DOI - PMC - PubMed
    1. Koury J., Lucero M., Cato C., Chang L., Geiger J., Henry D., Hernandez J., Hung F., Kaur P., Teskey G., et al. Immunotherapies: Exploiting the Immune System for Cancer Treatment. J. Immunol. Res. 2018;2018:9585614. doi: 10.1155/2018/9585614. - DOI - PMC - PubMed

LinkOut - more resources