. 2021 Aug 31;9(9):1120.
doi: 10.3390/biomedicines9091120.

Neural Precursor Cells Expanded Inside the 3D Micro-Scaffold Nichoid Present Different Non-Coding RNAs Profiles and Transcript Isoforms Expression: Possible Epigenetic Modulation by 3D Growth

Affiliations

Neural Precursor Cells Expanded Inside the 3D Micro-Scaffold Nichoid Present Different Non-Coding RNAs Profiles and Transcript Isoforms Expression: Possible Epigenetic Modulation by 3D Growth

Letizia Messa et al. Biomedicines. .

Abstract

Non-coding RNAs show relevant implications in various biological and pathological processes. Thus, understanding the biological implications of these molecules in stem cell biology still represents a major challenge. The aim of this work is to study the transcriptional dysregulation of 357 non-coding genes, found through RNA-Seq approach, in murine neural precursor cells expanded inside the 3D micro-scaffold Nichoid versus standard culture conditions. Through weighted co-expression network analysis and functional enrichment, we highlight the role of non-coding RNAs in altering the expression of coding genes involved in mechanotransduction, stemness, and neural differentiation. Moreover, as non-coding RNAs are poorly conserved between species, we focus on those with human homologue sequences, performing further computational characterization. Lastly, we looked for isoform switching as possible mechanism in altering coding and non-coding gene expression. Our results provide a comprehensive dissection of the 3D scaffold Nichoid's influence on the biological and genetic response of neural precursor cells. These findings shed light on the possible role of non-coding RNAs in 3D cell growth, indicating that also non-coding RNAs are implicated in cellular response to mechanical stimuli.

Keywords: 3D-microscaffold; Nichoid; RNA interactions; RNA-seq; alternative splicing; isoform switching; mechanotransduction; non-coding RNAs.


Conflict of interest statement

MTR is a co-founder of the spin-off company MOAB Srl and holds shares.

Figures

Figure 1
Figure 1
Change in morphology and transcription profiles in Neural Precursors Cells expanded inside the Nichoid. (A) On the left, in vivo direct light images (EVOS FL microscope, Euroclone) of NPCs neurospheres maintained in stem cells medium in standard floating conditions (Control NPCs) or grown, with the same medium, inside the Nichoid (Nichoid NPCs) for 7 days. Scale bar 400 μm. Images are representative of observations obtained in more than 10 experiments. On the right, representative images of Nichoid-grown NPCs analyzed by Environmental Scanning Electron Microscope (ESEM). Scale bar 20 μm. (B) For RNA-Seq, 3 samples for condition were analyzed. Specifically, three experiments were performed each including one sample of NPCs grown in standard floating conditions for 7 days and one sample of NPCs grown inside the Nichoid for 7 days. The graph shows the Heatmap and the PCA of non-coding differently expressed genes in NPCs grown on the Nichoid and in standard conditions. (C) Volcano plot showing only non-coding deregulated genes between NPCs grown on the Nichoid and in standard conditions. (D) Bar plot describing the classification of the non-coding deregulated genes found with RNA-Seq approach. Among the 357 non-coding deregulated genes, we identified 118 “unannotated genes”, 102 lncRNAs, 91 pseudogenes, and 46 small ncRNAs.
Figure 2
Figure 2
Weighted co-expression analysis network between the top 100 most deregulated coding and non-coding genes in terms of |log2FC|. (A) Clustering dendrograms of genes, with dissimilarity based on topological overlap, together with assigned module colors. As a result, 3 co-expression modules were constructed and were shown in different colors. The turquoise module was the largest one with 89 genes, followed by the blue with 62 genes and the brown with 46 genes. (B) Heatmap showing correlation between gene modules and conditions (e.g., Nichoid-growth NPCs and standard floating conditions). Different colors are related to different correlation values. For further analysis we focused our attention on turquoise and blue modules.
Figure 3
Figure 3
Study of investigated ncRNAs networks. On the basis of the turquoise and blue gene modules, two networks were constructed via Cytoscape. Both networks display coding genes represented in green or orange according to |log2FC|, lincRNAs light blue, antisense RNAs in pink, snoRNAs in dark blue. (A) The first network was obtained from the turquoise module. Here, 7 lincRNAs and 1 antisense, highlighted respectively in light blue and in pink, interact with each other and with 58 coding genes. All coding genes involved in this interaction are up-regulated and are thus represented in orange according to their fold change. (B) The second network was obtained from the blue module. Here, 9 lincRNAs, represented in light blue, and 2 antisense, represented in pink, interact with each other and with 37 coding genes. All coding genes involved in the interaction are down-regulated and are thus represented in green according to their fold change. Moreover, with respect to small ncRNAs, represented in dark blue, Snora28 co-interacts with Gm24494 and Snora61 in a smaller network, forming a non-coding only network.
Figure 4
Figure 4
GO enrichment analysis of co-expression modules. On the basis of the turquoise and blue modules we performed a functional enrichment analysis via the g:Profiler web tool by ranking genes according to |log2FC|. The top 10 deregulated pathways according to their significance are displayed. A significant deregulation was observed in GO categories, which include BP, MF, and CC. GO MF (A,B) highlighted respectively 184 significantly deregulated pathways for the turquoise module and 174 for the blue one. GO BP (C,D) highlighted 1428 pathways emerged as significantly deregulated for the turquoise module and 1193 for the blue one. GO CC (E,F) highlighted 130 significant terms from turquoise module and 73 form the blue one. The y-axis represents the name of the pathway, the x-axis represents the Rich factor, dot size represents the number of different genes, and the color indicates the adjusted p-value.
Figure 5
Figure 5
KEGG, Reactome, and WikiPathways enrichment analysis of co-expression modules. On the basis of the turquoise and blue modules we performed a functional enrichment analysis via the g:Profiler web tool by ranking genes according to |log2FC|. The top 10 deregulated pathways according to their significance are displayed. A significant deregulation was observed in KEGG, Reactome, and WikiPathways. KEGG (A,B) highlighted respectively 59 significantly deregulated pathways for the turquoise module and 25 for the blue one. Reactome (C,D) highlighted 151 pathways emerged as significantly deregulated for the turquoise module and 59 for the blue one. WikiPathways (E,F) highlighted 16 significant terms from turquoise module and 14 from the blue one. The y-axis represents the name of the pathway, the x-axis represents the Rich factor, dot size represents the number of different genes, and the color indicates the adjusted p-value.
Figure 6
Figure 6
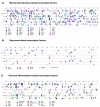
Transcription Factors binding sites for lncRNAs with human homologues. This evaluation was performed with the Ciiider software. Among 644 TFs predicted, 30 out of 644 were associated with mechanotransduction (A), 8 out of 644 were stemness TFs (B), and 20 out of 644 were neural TFs (C).
Figure 7
Figure 7
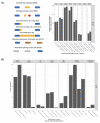
Genome-wide transcripts analysis for switched isoforms between Nichoid-expanded NPCs and standard floating conditions. (A) Illustration of alternative splicing event types for the switched isoforms and distribution of isoform usage (increased or decreased dIF) in each type. Created with BioRender.com. (B) Overview of the number of switched isoforms predicted to have functional consequences. (C) Visualization of switched isoform structure for Cntrl. KEGG (D) and Reactome (E) enrichment analysis for switched isoforms identified. The y-axis represents the name of the pathway, the x-axis represents the Rich factor, dot size represents the number of different genes, and the color indicates the adjusted p-value.
Figure 7
Figure 7
Genome-wide transcripts analysis for switched isoforms between Nichoid-expanded NPCs and standard floating conditions. (A) Illustration of alternative splicing event types for the switched isoforms and distribution of isoform usage (increased or decreased dIF) in each type. Created with BioRender.com. (B) Overview of the number of switched isoforms predicted to have functional consequences. (C) Visualization of switched isoform structure for Cntrl. KEGG (D) and Reactome (E) enrichment analysis for switched isoforms identified. The y-axis represents the name of the pathway, the x-axis represents the Rich factor, dot size represents the number of different genes, and the color indicates the adjusted p-value.
Figure 8
Figure 8
Role of 3D scaffold Nichoid in gene expression and mechanotransduction processes. Enlargement of a cell inside the 3D scaffold Nichoid with two of its possible mechanisms of action. On the left, a first proposed mechanism is that mechanotransduction altered by the 3D scaffold might influence coding genes and specific TFs which in turn control non-coding RNAs expression implicated in stemness and pluripotency. On the right, a second possible hypothesis is that mecha-notransduction altered by the 3D scaffols might affect non-coding genes that themselves influence coding gene expression and consequently stemness and pluripotency phenotype. Created with BioRender.com.

Similar articles

Cited by

References

    1. Quinn J.J., Chang H.Y. Unique features of long non-coding RNA biogenesis and function. Nat. Rev. Genet. 2016;17:47–62. doi: 10.1038/nrg.2015.10. - DOI - PubMed
    1. Mattick J.S. The genetic signatures of noncoding RNAs. PLoS Genet. 2009;5:e1000459. doi: 10.1371/journal.pgen.1000459. - DOI - PMC - PubMed
    1. Ponting C.P., Oliver P.L., Reik W. Evolution and functions of long noncoding RNAs. Cell. 2009;136:629–641. doi: 10.1016/j.cell.2009.02.006. - DOI - PubMed
    1. Consortium E.P. An integrated encyclopedia of DNA elements in the human genome. Nature. 2012;489:57–74. doi: 10.1038/nature11247. - DOI - PMC - PubMed
    1. Engreitz J.M., Ollikainen N., Guttman M. Long non-coding RNAs: Spatial amplifiers that control nuclear structure and gene expression. Nat. Rev. Mol. Cell Biol. 2016;17:756–770. doi: 10.1038/nrm.2016.126. - DOI - PubMed