

Normalizing HIF-1α Signaling Improves Cellular Glucose Metabolism and Blocks the Pathological Pathways of Hyperglycemic Damage
- PMID: 34572324
- PMCID: PMC8471680
- DOI: 10.3390/biomedicines9091139
Normalizing HIF-1α Signaling Improves Cellular Glucose Metabolism and Blocks the Pathological Pathways of Hyperglycemic Damage
Abstract
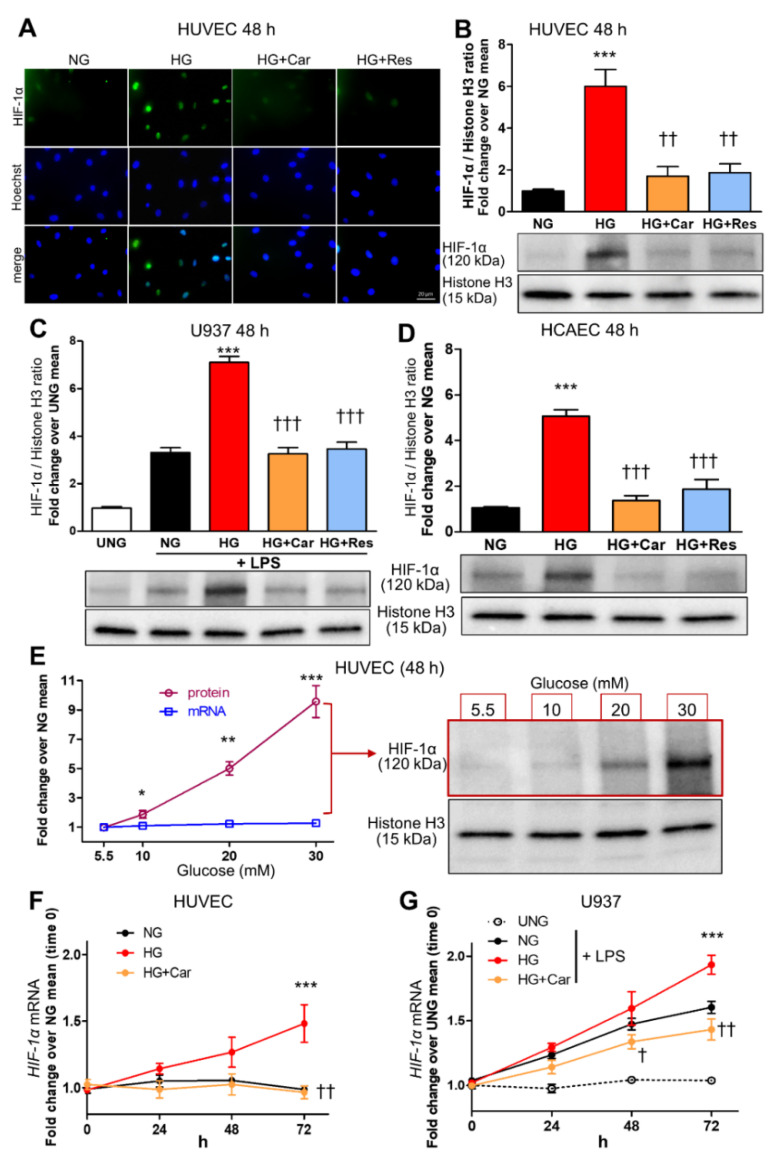
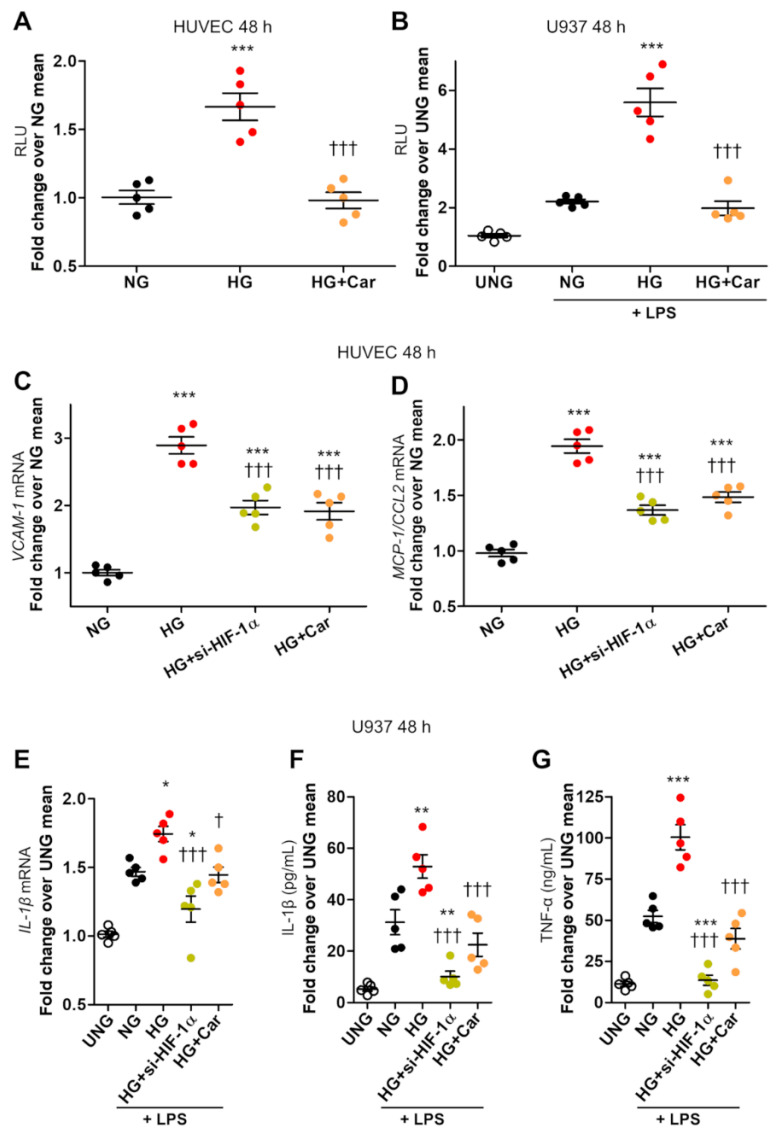
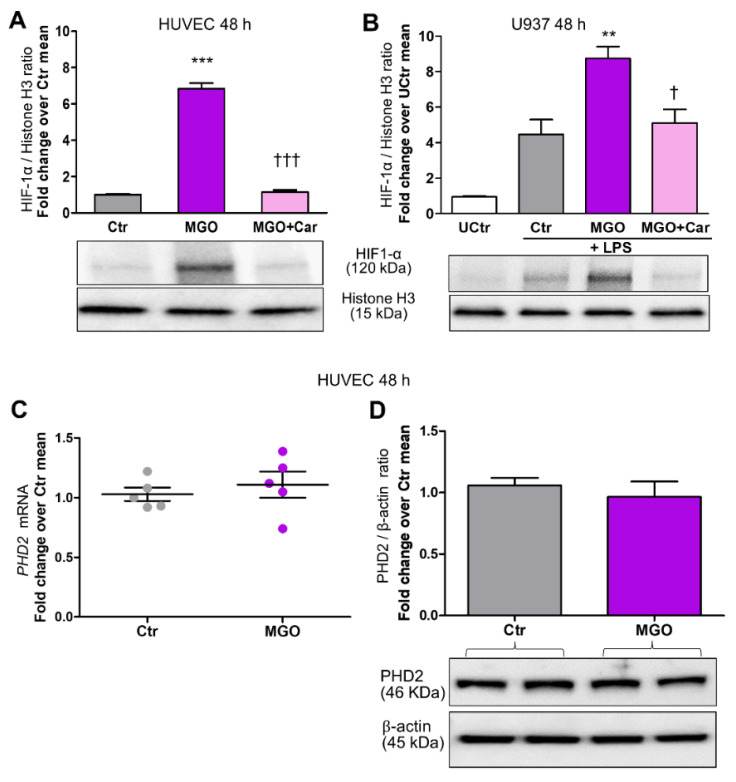
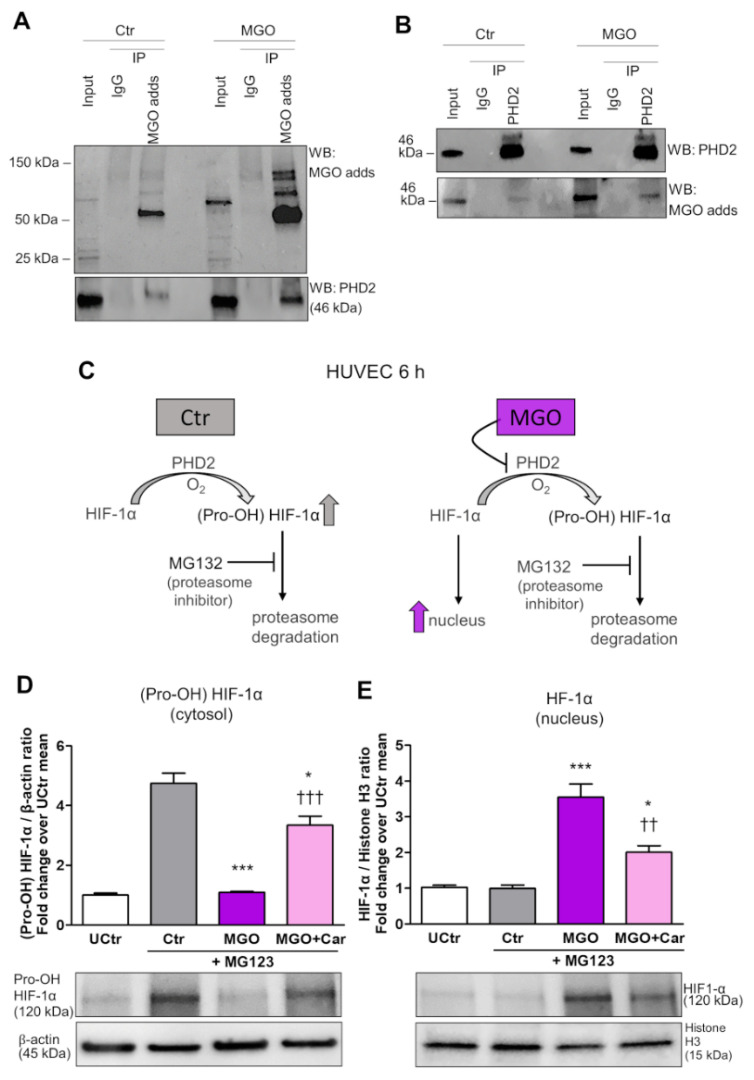
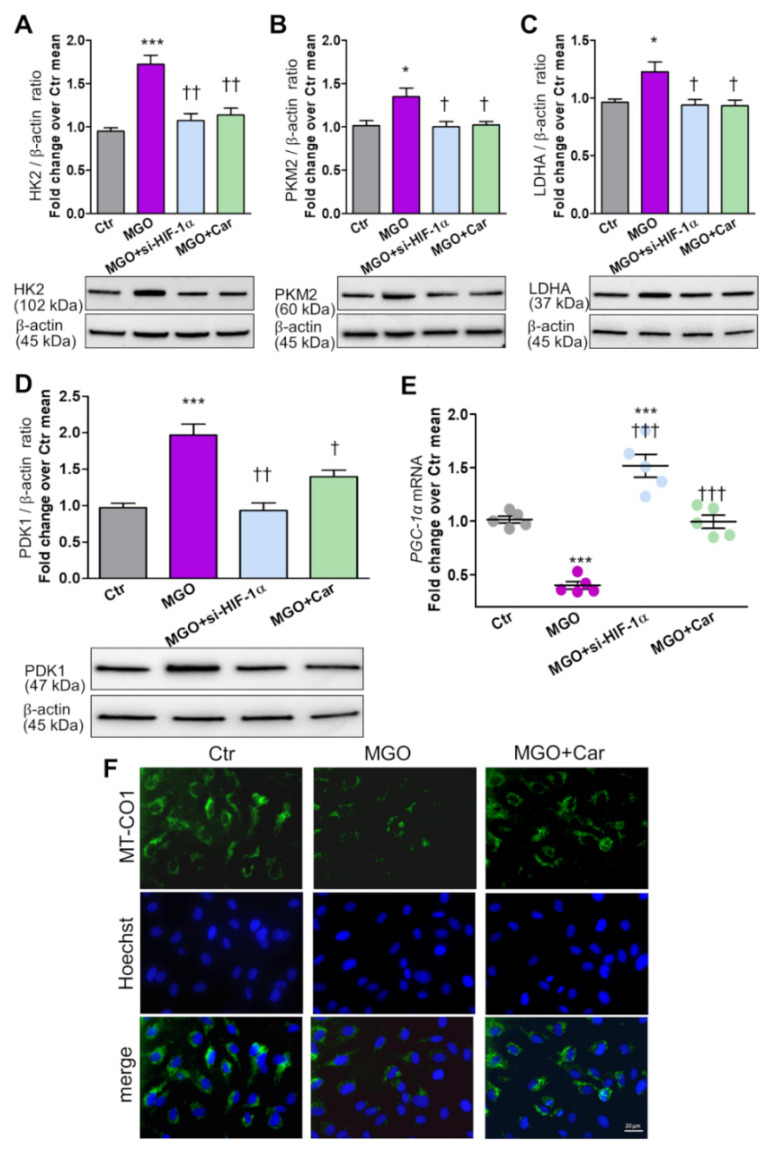
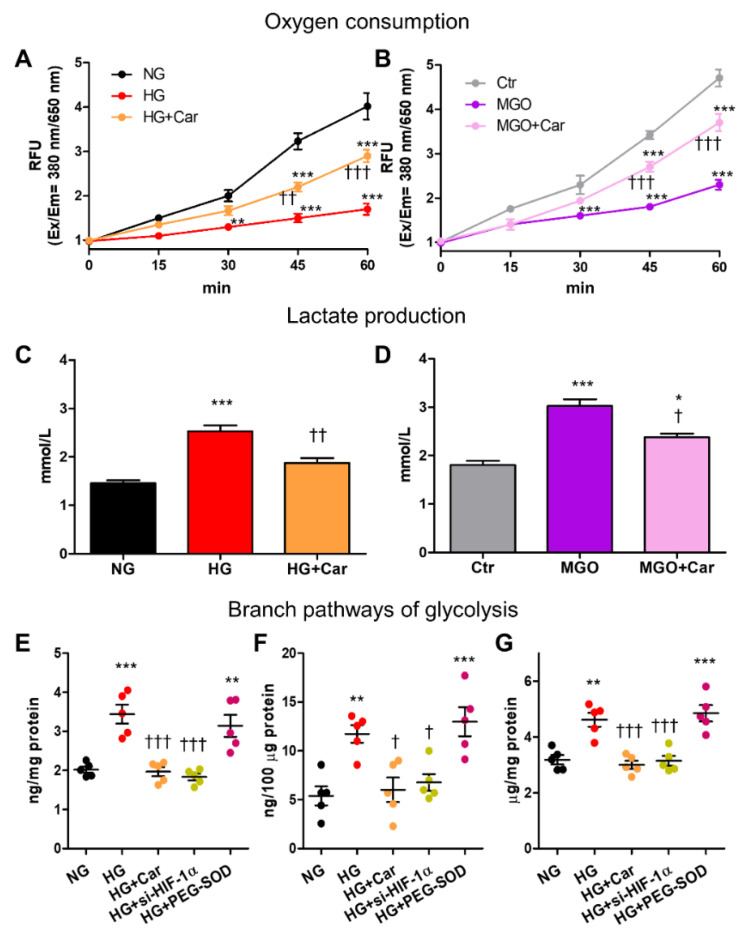
Intracellular metabolism of excess glucose induces mitochondrial dysfunction and diversion of glycolytic intermediates into branch pathways, leading to cell injury and inflammation. Hyperglycemia-driven overproduction of mitochondrial superoxide was thought to be the initiator of these biochemical changes, but accumulating evidence indicates that mitochondrial superoxide generation is dispensable for diabetic complications development. Here we tested the hypothesis that hypoxia inducible factor (HIF)-1α and related bioenergetic changes (Warburg effect) play an initiating role in glucotoxicity. By using human endothelial cells and macrophages, we demonstrate that high glucose (HG) induces HIF-1α activity and a switch from oxidative metabolism to glycolysis and its principal branches. HIF1-α silencing, the carbonyl-trapping and anti-glycating agent ʟ-carnosine, and the glyoxalase-1 inducer trans-resveratrol reversed HG-induced bioenergetics/biochemical changes and endothelial-monocyte cell inflammation, pointing to methylglyoxal (MGO) as the non-hypoxic stimulus for HIF1-α induction. Consistently, MGO mimicked the effects of HG on HIF-1α induction and was able to induce a switch from oxidative metabolism to glycolysis. Mechanistically, methylglyoxal causes HIF1-α stabilization by inhibiting prolyl 4-hydroxylase domain 2 enzyme activity through post-translational glycation. These findings introduce a paradigm shift in the pathogenesis and prevention of diabetic complications by identifying HIF-1α as essential mediator of glucotoxicity, targetable with carbonyl-trapping agents and glyoxalase-1 inducers.
Keywords: Warburg effect; carnosine; cellular energetics; diabetes; glycolysis; hyperglycemia; inflammation; methylglyoxal; prolyl 4-hydroxylase 2; trans-resveratrol.
Conflict of interest statement
The authors declare that they have no competing interest.
Figures
Similar articles
-
Mutual Regulation between Redox and Hypoxia-Inducible Factors in Cardiovascular and Renal Complications of Diabetes.Antioxidants (Basel). 2022 Nov 4;11(11):2183. doi: 10.3390/antiox11112183. Antioxidants (Basel). 2022. PMID: 36358555 Free PMC article. Review.
-
Enhanced Aerobic Glycolysis by S-Nitrosoglutathione via HIF-1α Associated GLUT1/Aldolase A Axis in Human Endothelial Cells.J Cell Biochem. 2017 Aug;118(8):2443-2453. doi: 10.1002/jcb.25911. Epub 2017 Apr 25. J Cell Biochem. 2017. PMID: 28121054
-
Impairment of HIF-1α-mediated metabolic adaption by NRF2-silencing in breast cancer cells.Redox Biol. 2019 Jun;24:101210. doi: 10.1016/j.redox.2019.101210. Epub 2019 May 2. Redox Biol. 2019. PMID: 31078780 Free PMC article.
-
Qiliqiangxin attenuates hypoxia-induced injury in primary rat cardiac microvascular endothelial cells via promoting HIF-1α-dependent glycolysis.J Cell Mol Med. 2018 May;22(5):2791-2803. doi: 10.1111/jcmm.13572. Epub 2018 Mar 4. J Cell Mol Med. 2018. PMID: 29502357 Free PMC article.
-
Regulation of glycolysis by the hypoxia-inducible factor (HIF): implications for cellular physiology.J Physiol. 2021 Jan;599(1):23-37. doi: 10.1113/JP280572. Epub 2020 Oct 15. J Physiol. 2021. PMID: 33006160 Review.
Cited by
-
Carnosinase-1 Knock-Out Reduces Kidney Fibrosis in Type-1 Diabetic Mice on High Fat Diet.Antioxidants (Basel). 2023 Jun 14;12(6):1270. doi: 10.3390/antiox12061270. Antioxidants (Basel). 2023. PMID: 37372000 Free PMC article.
-
Evolving Strategies in the Treatment of Anaemia in Chronic Kidney Disease: The HIF-Prolyl Hydroxylase Inhibitors.Drugs. 2022 Nov;82(16):1565-1589. doi: 10.1007/s40265-022-01783-3. Epub 2022 Nov 9. Drugs. 2022. PMID: 36350500 Free PMC article. Review.
-
Dicarbonyl Stress in Diabetic Vascular Disease.Int J Mol Sci. 2022 May 31;23(11):6186. doi: 10.3390/ijms23116186. Int J Mol Sci. 2022. PMID: 35682865 Free PMC article. Review.
-
The "sweet" path to cancer: focus on cellular glucose metabolism.Front Oncol. 2023 May 25;13:1202093. doi: 10.3389/fonc.2023.1202093. eCollection 2023. Front Oncol. 2023. PMID: 37305566 Free PMC article. Review.
-
Hypoxia suppresses glucose-induced increases in collective cell migration in vascular endothelial cell monolayers.Sci Rep. 2024 Mar 2;14(1):5164. doi: 10.1038/s41598-024-55706-1. Sci Rep. 2024. PMID: 38431674 Free PMC article.
References
-
- Sourris K.C., Harcourt B.E., Tang P.H., Morley A.L., Huynh K., Penfold S.A., Coughlan M.T., Cooper M.E., Nguyen T.V., Ritchie R.H., et al. Ubiquinone (Coenzyme Q10) Prevents Renal Mitochondrial Dysfunction in an Experimental Model of Type 2 Diabetes. Free Radic. Biol. Med. 2012;52:716–723. doi: 10.1016/j.freeradbiomed.2011.11.017. - DOI - PubMed
-
- Dugan L.L., You Y.H., Ali S.S., Diamond-Stanic M., Miyamoto S., DeCleves A.E., Andreyev A., Quach T., Ly S., Shekhtman G., et al. AMPK Dysregulation Promotes Diabetes-Related Reduction of Superoxide and Mitochondrial Function. J. Clin. Investig. 2013;123:4888–4899. doi: 10.1172/JCI66218. - DOI - PMC - PubMed
Grants and funding
LinkOut - more resources
Full Text Sources
Research Materials
