. 2021 Sep 3;9(9):1146.
doi: 10.3390/biomedicines9091146.

Effective Accentuation of Voltage-Gated Sodium Current Caused by Apocynin (4'-Hydroxy-3'-methoxyacetophenone), a Known NADPH-Oxidase Inhibitor

Affiliations

Effective Accentuation of Voltage-Gated Sodium Current Caused by Apocynin (4'-Hydroxy-3'-methoxyacetophenone), a Known NADPH-Oxidase Inhibitor

Tzu-Hsien Chuang et al. Biomedicines. .

Abstract

Apocynin (aPO, 4'-Hydroxy-3'-methoxyacetophenone) is a cell-permeable, anti-inflammatory phenolic compound that acts as an inhibitor of NADPH-dependent oxidase (NOX). However, the mechanisms through which aPO can interact directly with plasmalemmal ionic channels to perturb the amplitude or gating of ionic currents in excitable cells remain incompletely understood. Herein, we aimed to investigate any modifications of aPO on ionic currents in pituitary GH3 cells or murine HL-1 cardiomyocytes. In whole-cell current recordings, GH3-cell exposure to aPO effectively stimulated the peak and late components of voltage-gated Na+ current (INa) with different potencies. The EC50 value of aPO required for its differential increase in peak or late INa in GH3 cells was estimated to be 13.2 or 2.8 μM, respectively, whereas the KD value required for its retardation in the slow component of current inactivation was 3.4 μM. The current-voltage relation of INa was shifted slightly to more negative potential during cell exposure to aPO (10 μM); however, the steady-state inactivation curve of the current was shifted in a rightward direction in its presence. Recovery of peak INa inactivation was increased in the presence of 10 μM aPO. In continued presence of aPO, further application of rufinamide or ranolazine attenuated aPO-stimulated INa. In methylglyoxal- or superoxide dismutase-treated cells, the stimulatory effect of aPO on peak INa remained effective. By using upright isosceles-triangular ramp pulse of varying duration, the amplitude of persistent INa measured at low or high threshold was enhanced by the aPO presence, along with increased hysteretic strength appearing at low or high threshold. The addition of aPO (10 μM) mildly inhibited the amplitude of erg-mediated K+ current. Likewise, in HL-1 murine cardiomyocytes, the aPO presence increased the peak amplitude of INa as well as decreased the inactivation or deactivation rate of the current, and further addition of ranolazine or esaxerenone attenuated aPO-accentuated INa. Altogether, this study provides a distinctive yet unidentified finding that, despite its effectiveness in suppressing NOX activity, aPO may directly and concertedly perturb the amplitude, gating and voltage-dependent hysteresis of INa in electrically excitable cells. The interaction of aPO with ionic currents may, at least in part, contribute to the underlying mechanisms through which it affects neuroendocrine, endocrine or cardiac function.

Keywords: NADPH-dependent oxidase (NOX); apocynin (4′-Hydroxy-3′-methoxyacetophenone); current kinetics; electrically excitable cell; erg-mediated K+ current; persistent Na+ current; voltage-dependent hysteresis; voltage-gated Na+ current.


Conflict of interest statement

The authors declare no competing interests that are directly relevant to the present study.

Figures
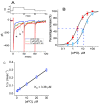
Figure 1
Figure 1
Effect of aPO on the peak and late components of voltage-gated Na+ current (INa) identified in pituitary GH3 cells. These experiments were undertaken in cells bathed in Ca2+-free Tyrode’s solution containing 10 mM tetraethylammonium chloride (TEA), whereas the recording pipette was filled up with Cs+-enriched solution. (A) Representative INa traces activated by brief depolarizing pulse (indicated in the upper part). a: control (i.e., aPO was not present); b: 3 μM aPO; c: 10 μM aPO. (B) Concentration-dependent stimulation of aPO on peak or late INa (mean ± SEM; n = 8 for each point). The peak (□) or late () amplitude of the current was measured at the beginning or end of a 40-ms depolarizing pulse from −80 to −10 mV. Data analysis was performed by ANOVA-1 (p < 0.05). Each continuous line illustrates the goodness-of-fit to the Hill equation, as elaborated in Materials and Methods. The vertical broken line indicates the EC50 value required for 50% stimulation of the current (peak or late INa). (C) The relationship of the reciprocal to the time constant (i.e., 1/∆τ) versus the aPO concentration was plotted (mean ± SEM; n = 7–11 for each point). From the binding scheme (indicated under Materials and Methods), the forward (k+1*) or backward (k−1) rate constant for aPO-accentuated INa in GH3 cells was computed to be 0.00898 ms−1μM−1 or 0.0303 ms−1, respectively.
Figure 2
Figure 2
Stimulatory effect of aPO on averaged current–voltage (I-V) relationship (A) and steady-state inactivation curve (B) of INa present in GH3 cells. Cells were kept bathed in Ca2+-free Tyrode’s solution containing 10 mM TEA. (A) Averaged I-V relationships of INa in the absence () and presence () of 10 μM aPO (mean ± SEM; n = 8 for each point). The examined cell was held at −80 mV and the 40-ms voltage pulse ranging from −80 to +40 mV in 10-mV steps was delivered to it. The statistical analyses were undertaken by ANOVA-2 for repeated measures, p (factor 1, groups among data ken at different level of voltages) < 0.05, p (factor 2, groups between the absence and presence of aPO) < 0.05, p (interaction) < 0.05, followed by post-hoc Fisher’s least-significant difference test, p < 0.05). (B) Effect of aPO on the steady-state inactivation curve of INa taken without () or with () the addition of 10 μM aPO. In these experiments, the conditioning voltage pulses with a duration of 40 ms to various membrane potentials between −120 and +20 mV were applied from a holding potential of −80 mV. Following each conditioning potential, a test pulse to −10 mV with a duration of 40 ms was delivered to activate INa. The normalized amplitude of INa (I/Imax) was constructed against the conditioning potential and the sigmoidal curves were optimally fitted by the Boltzmann equation (indicated under Materials and Methods). Each point represents the mean ± SEM (n = 7). The statistical analyses were undertaken by ANOVA-2 for repeated measures, p (factor 1, groups among data ken at different level of conditioning potentials) < 0.05, p (factor 2, groups between the absence and presence of aPO) < 0.05, p (interaction) < 0.05, followed by post-hoc Fisher’s least-significant difference test, p < 0.05).
Figure 3
Figure 3
Effect of aPO on the time course of recovery from INa inactivation. The cell tested was depolarized from −80 to −10 mV with a duration of 50 ms, and voltage-clamp commands with varying durations of interpulse interval (i.e., the interval between the first and second pulses) were applied to it. (A) Superimposed INa traces in the presence of 10 μM aPO. The upper part shows the voltage protocol applied. The dashed arrow indicates the trajectory of current inactivation elicited by different durations of interpulse pulse. (B) Effect of aPO on the time course of recovery from current inactivation, as the cells examined were depolarized from −80 to −10 mV. : control; : aPO (10 μM). Each smooth line was optimally fitted by a single-exponential function. The relative amplitude denotes that the peak INa taken at the second pulse is divided by that at the first one. Each point represents the mean ± SEM (n = 8). The statistical analyses were undertaken by ANOVA-2 for repeated measures, p (factor 1, groups among data ken at different interpulse intervals) < 0.05, p (factor 2, groups between the absence and presence of aPO) < 0.05, p (interaction) < 0.05, followed by post-hoc Fisher’s least-significant difference test, p < 0.05).
Figure 4
Figure 4
Effect of aPO, tefluthrin (Tef), Tef plus aPO, aPO plus rufinamide (RFM), and aPO plus ranolazine (Ran) on peak amplitude of INa identified in GH3 cells. (A) Representative INa traces activated by depolarizing pulse (as indicated in the upper part). a: control; b: 10 μM aPO; c: 10 μM aPO plus 10 μM RFM. (B) Summary bar graph showing effect of aPO, Tef, Tef plus aPO, aPO plus RFM, and aPO plus Ran on peak INa (mean ± SEM; n = 8–10 for each bar). The number of the control group is 10, while those in other groups are 8. Data analysis was performed by ANOVA-1 (p < 0.05). * Significantly different from control (p < 0.05) and ** significantly different from aPO (10 μM) alone group (p < 0.05).
Figure 5
Figure 5
Stimulatory effect of aPO on averaged I-V relationship of INa in GH3 cells treated with methylglyoxal (MeG) (A) or with superoxide dismutase (SOD) (B). GH3 cells were preincubated with 10 μM MeG for 6 h. Cells were bathed in Ca2+-free Tyrode’s solution and the pipette was filled up with Cs+-containing solution. The cell tested was maintained at −80 mV and the depolarizing pulses ranging between −80 and +40 mV were thereafter delivered to it. Each point represents the mean ± SEM (n = 7). Inset denotes the voltage-clamp protocol used. or □: control; ●or : aPO (10 μM). Noticeably, in MeG- or SOD-treated cells, the stimulatory effect of aPO on the overall I-V relationships of peak INa was altered little. The statistical analyses were undertaken by ANOVA-2 for repeated measures, p (factor 1, groups among data taken at different levels of voltages) < 0.05, p (factor 2, groups between the absence and presence of aPO) < 0.05, p (interaction) < 0.05, followed by post-hoc Fisher’s least-significant difference test, p < 0.05).
Figure 6
Figure 6
Effect of aPO on voltage-dependent hysteresis (Vhys) of persistent INa (INa(P)) activated by isosceles-triangular ramp pulses with varying ramp duration in GH3 cells. In this series of whole-cell current recordings, we voltage-clamped the tested cell at −80 mV and the isosceles-triangular ramp voltage with varying duration of 0.4 to 3.2 s (i.e., ramp speed of ±0.1 to 0.8 mV/ms) to activate INa(P) in response to the forward (i.e., ascending from −110 to +50 mV) and backward (descending from +50 to −110 mV) that was thereafter applied to it. (A) Representative INa(P) traces obtained in the control period (upper, aPO was not present), and during cell exposure to 10 μM aPO (lower). The uppermost part shows varying durations of isosceles-triangular ramp pulse applied. Of notice, the presence of aPO can augment the INa(P) amplitude elicited by the upsloping and downsloping limbs of the triangular ramp. (B) Representative instantaneous I-V relation of INa(P) in response to isosceles-triangular ramp pulse (the voltage between −100 and +50 mV) with a duration of 3.2 s (as indicated in the left side of panel (B)). Current trace in the left side is control, while that in the right side was acquired from the presence of 10 μM aPO. The dashed arrows in the left side show the direction of INa(P) trajectory in which time passes during the elicitation by the upright isosceles-triangular ramp pulse. Of interest, a striking figure-of-eight (or infinity-shaped: ∞) exists in the Vhys trajectory responding to the triangular ramp. (C) Summary bar graph demonstrating the effect of aPO and aPO plus Ran on INa(P) amplitude activated by the upsloping and downsloping limbs of 3.2-s triangular ramp pulse (mean ± SEM; n = 8 for each bar). Current amplitudes in the left side were taken at the level of 0 mV in situations where the 1.6-s ascending (upsloping) end of the triangular pulse was delivered to elicit INa(P) (i.e., high-threshold INa(P), while those in the right side (i.e., low-threshold INa(P)) was at −80 mV during the descending (downsloping) end of the pulse. Current amplitude measured is illustrated in the absolute value. Data analyses were performed by ANOVA-1 (p < 0.05). * Significantly different from controls (p < 0.05) and ** significantly different from aPO (30 μM) alone groups (p < 0.05).
Figure 6
Figure 6
Effect of aPO on voltage-dependent hysteresis (Vhys) of persistent INa (INa(P)) activated by isosceles-triangular ramp pulses with varying ramp duration in GH3 cells. In this series of whole-cell current recordings, we voltage-clamped the tested cell at −80 mV and the isosceles-triangular ramp voltage with varying duration of 0.4 to 3.2 s (i.e., ramp speed of ±0.1 to 0.8 mV/ms) to activate INa(P) in response to the forward (i.e., ascending from −110 to +50 mV) and backward (descending from +50 to −110 mV) that was thereafter applied to it. (A) Representative INa(P) traces obtained in the control period (upper, aPO was not present), and during cell exposure to 10 μM aPO (lower). The uppermost part shows varying durations of isosceles-triangular ramp pulse applied. Of notice, the presence of aPO can augment the INa(P) amplitude elicited by the upsloping and downsloping limbs of the triangular ramp. (B) Representative instantaneous I-V relation of INa(P) in response to isosceles-triangular ramp pulse (the voltage between −100 and +50 mV) with a duration of 3.2 s (as indicated in the left side of panel (B)). Current trace in the left side is control, while that in the right side was acquired from the presence of 10 μM aPO. The dashed arrows in the left side show the direction of INa(P) trajectory in which time passes during the elicitation by the upright isosceles-triangular ramp pulse. Of interest, a striking figure-of-eight (or infinity-shaped: ∞) exists in the Vhys trajectory responding to the triangular ramp. (C) Summary bar graph demonstrating the effect of aPO and aPO plus Ran on INa(P) amplitude activated by the upsloping and downsloping limbs of 3.2-s triangular ramp pulse (mean ± SEM; n = 8 for each bar). Current amplitudes in the left side were taken at the level of 0 mV in situations where the 1.6-s ascending (upsloping) end of the triangular pulse was delivered to elicit INa(P) (i.e., high-threshold INa(P), while those in the right side (i.e., low-threshold INa(P)) was at −80 mV during the descending (downsloping) end of the pulse. Current amplitude measured is illustrated in the absolute value. Data analyses were performed by ANOVA-1 (p < 0.05). * Significantly different from controls (p < 0.05) and ** significantly different from aPO (30 μM) alone groups (p < 0.05).
Figure 7
Figure 7
Effect of aPO on erg-mediated K+ current (IK(erg)) in GH3 cells. The experiments were undertaken in cells that were bathed in high-K+, Ca2+-free solution containing 1 μM tetrodotoxin (TTX), and the recording pipette was filled up with K+-containing internal solution. (A) Representative IK(erg) traces obtained in the control (a) and during cell exposure to 10 μM aPO (b). The examined cell was held at −10 mV and a downsloping ramp from −10 to −100 mV with a duration of 1 s (indicated in the inset) was applied to it. The dashed arrow indicates the direction of current trajectory in which time passes, while the asterisk shows the inwardly-rectifying property of IK(erg). (B) Summary bar graph showing effect of aPO and aPO plus E-4031 on the amplitude of IK(erg) (mean ± SEM; n = 8 for each bar). Current amplitude (i.e., peak IK(erg) amplitude) was measured at the level of −70 mV. Data analyses were performed by ANOVA-1 (p < 0.05). * Significantly different from control (p < 0.05) and ** significantly different from the aPO (10 μM) alone group (p < 0.05).
Figure 8
Figure 8
Effect of aPO on depolarization-activated INa present in HL-1 cardiomyocytes. In this set of experiments, we kept cells immersed in Ca2+-free Tyrode’s solution and the electrode was filled with Cs+-enriched solution. When whole-cell configuration was established, we voltage-clamped the cell at −80 mV and the brief depolarization to −10 mV was delivered to it. (A) Representative INa traces activated by depolarizing command pulse (indicated in the upper part). a: control; b: 3 μM aPO; c: 10 μM aPO. (B) Summary bar graph showing effects of aPO, aPO plus ranolazine (Ran), and aPO plus esaxerenone (ESAX) on peak amplitude of INa in HL-1 heart cells (mean ± SEM; n = 8 for each bar). Current amplitude was measured at the beginning of 50-ms depolarizing pulses from −80 to −10 mV. Data analyses were performed by ANOVA-1 (p < 0.05). * Significantly different from control (p < 0.05) and ** Significantly different aPO (10 μM) alone group (p < 0.05).

Similar articles

Cited by

References

    1. Yang T., Zang D.-W., Shan W., Guo A.-C., Wu J.-P., Wang Y.-J., Wang Q. Synthesis and Evaluations of Novel Apocynin Derivatives as Anti-Glioma Agents. Front. Pharmacol. 2019;10:951. doi: 10.3389/fphar.2019.00951. - DOI - PMC - PubMed
    1. Stefanska J., Pawliczak R. Apocynin: Molecular Aptitudes. Mediat. Inflamm. 2008;2008:1–10. doi: 10.1155/2008/106507. - DOI - PMC - PubMed
    1. Petrônio M.S., Zeraik M.L., Da Fonseca L.M., Ximenes V.F. Apocynin: Chemical and Biophysical Properties of a NADPH Oxidase Inhibitor. Molecules. 2013;18:2821–2839. doi: 10.3390/molecules18032821. - DOI - PMC - PubMed
    1. Abliz A., Chen C., Deng W., Wang W., Sun R. NADPH Oxidase Inhibitor Apocynin Attenuates PCB153-Induced Thyroid Injury in Rats. Int. J. Endocrinol. 2016;2016:8354745. doi: 10.1155/2016/8354745. - DOI - PMC - PubMed
    1. Du Z.-D., Yu S., Qi Y., Qu T.-F., He L., Wei W., Liu K., Gong S.-S. NADPH oxidase inhibitor apocynin decreases mitochondrial dysfunction and apoptosis in the ventral cochlear nucleus of D-galactose-induced aging model in rats. Neurochem. Int. 2019;124:31–40. doi: 10.1016/j.neuint.2018.12.008. - DOI - PubMed

LinkOut - more resources