. 2021 Sep 12;9(9):1205.
doi: 10.3390/biomedicines9091205.

The Effects of Simulated Microgravity on Macrophage Phenotype

Affiliations

The Effects of Simulated Microgravity on Macrophage Phenotype

Christopher Ludtka et al. Biomedicines. .

Abstract

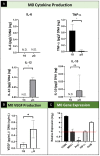
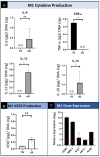
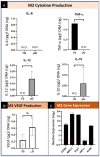
The effects of spaceflight, including prolonged exposure to microgravity, can have significant effects on the immune system and human health. Altered immune cell function can lead to adverse health events, though precisely how and to what extent a microgravity environment impacts these cells remains uncertain. Macrophages, a key immune cell, effect the inflammatory response as well as tissue remodeling and repair. Specifically, macrophage function can be dictated by phenotype that can exist between spectrums of M0 macrophage: the classically activated, pro-inflammatory M1, and the alternatively activated, pro-healing M2 phenotypes. This work assesses the effects of simulated microgravity via clinorotation on M0, M1, and M2 macrophage phenotypes. We focus on phenotypic, inflammatory, and angiogenic gene and protein expression. Our results show that across all three phenotypes, microgravity results in a decrease in TNF-α expression and an increase in IL-12 and VEGF expression. IL-10 was also significantly increased in M1 and M2, but not M0 macrophages. The phenotypic cytokine expression profiles observed may be related to specific gravisensitive signal transduction pathways previously implicated in microgravity regulation of macrophage gene and protein expression. Our results highlight the far-reaching effects that simulated microgravity has on macrophage function and provides insight into macrophage phenotypic function in microgravity.

Keywords: alternatively activated; classically activated; immune; macrophage; microgravity; phenotype; pro-inflammation.


Conflict of interest statement

The authors declare no conflict of interest

Figures

Figure 1
Figure 1
Visual schematic of experimental design. Purple arrows indicate preparations of cells prior to RWV culture for all three phenotypes. Red and blue arrows indicate simulated µG samples and control 1G samples, respectively, were analyzed via RT-PCR and ELISA subsequent to 3 days of cell culture under their respective conditions. Created with BioRender.com.
Figure 2
Figure 2
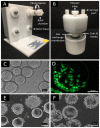
Rotary Cell Culture System Rotating Wall Vessel (RWV) bioreactor and representative microscopy images of RAW 264.7 macrophage cells on microcarrier beads. (A) RWV bioreactor base; (B) RWV bioreactor detachable vessel chamber; (C) M2 macrophage phenotype after 2-day attachment and polarization period (scale bar 100 μm); (D) Calcein-stained M2 macrophage cells after 2-day attachment period; dotted grey circle to approximate underlying bead for visual clarity (scale bar 50 μm); (E) 1G normal gravity control M2 macrophages (scale bar 100 μm); and (F) simulated µG M2 macrophages after 3-day period in RWV chambers (scale bar 100 μm).
Figure 3
Figure 3
Summary of the effect of simulated microgravity on M0 macrophage protein and gene expression. (A) Quantification of M0 macrophage secretion of inflammatory cytokines while cultured in both normal gravity (1G) and simulated microgravity (µG) for IL-6, TNF-α, IL-10, and IL-12. Data normalized to DNA concentration and are presented as Mean +/− SD, n = 3. N.D. indicates the concentration did not reach the threshold for the assay and thus is Not Detected. Significance determined by unpaired Student’s t-test; * denotes p < 0.05; ns denotes non-significant. (B) Quantification of VEGF secretion by M0 macrophages cultured in normal gravity (1G) and simulated microgravity (µG). Data normalized to DNA concentration and are presented as Mean +/− SD, n = 3; Significance determined by unpaired Student’s t-test; * denotes p < 0.05. (C) Gene expression of M0 phenotype macrophages for M1 specific (CD86) and M2 specific (MRC1 and Arg1) genes, transcription factor, HIF1α, and structural gene ActB. Data displayed as relative expression of simulated µG samples compared to 1G controls (red line).
Figure 4
Figure 4
Summary of the effect of simulated microgravity on M1 macrophage protein and gene expression. (A) Quantification of M1 macrophage secretion of inflammatory cytokines while cultured in both normal gravity (1G) and simulated microgravity (µG) for IL-6, TNF-α, IL-10, and IL-12. Data normalized to DNA concentration and are presented as Mean +/− SD, n = 3. N.D. indicates Table 1 macrophages cultured in normal gravity (1G) and simulated microgravity (µG). Data normalized to DNA concentration and are presented as Mean +/− SD, n = 3; Significance determined by unpaired Student’s t-test; * denotes p < 0.05; ns denotes non-significant. (B) Quantification of VEGF secretion by M1 macrophages cultured in normal gravity (1G) and simulated microgravity (µG). Data normalized to DNA concentration and are presented as Mean +/− SD, n = 3; Significance determined by unpaired Student’s t-test; * denotes p < 0.05; ** denotes p < 0.01. (C) Gene expression of M1 phenotype macrophages for M1 specific (CD86) and M2 specific (MRC1 and Arg1) genes, transcription factor, HIF1α, and structural gene ActB. Data displayed as relative expression of simulated µG samples compared to 1G controls (red line).
Figure 5
Figure 5
Summary of the effect of simulated microgravity on M2 macrophage protein and gene expression. (A) Quantification of M2 macrophage secretion of inflammatory cytokines while cultured in both normal gravity (1G) and simulated microgravity (µG) for IL-6, TNF-α, IL-10, and IL-12. Data normalized to DNA concentration and are presented as Mean +/− SD, n = 3. N.D. indicates the concentration did not reach the threshold for the assay and thus is Not Detected. Significance determined by unpaired Student’s t-test; * denotes p < 0.05. (B) Quantification of VEGF secretion by M2 macrophages cultured in normal gravity (1G) and simulated microgravity (µG). Data normalized to DNA concentration and are presented as Mean +/− SD, n = 3; Significance determined by unpaired Student’s t-test; ns denotes non-significant. (C) Gene expression of M2 phenotype macrophages for M1 specific (CD86) and M2 specific (MRC1 and Arg1) genes, HIF1α, and ActB. Data displayed as relative expression of simulated µG samples compared to 1G controls (red line).

References

    1. Blaber E., Marçal H., Burns B.P. Bioastronautics: The influence of microgravity on astronaut health. Astrobiology. 2010;10:463–473. doi: 10.1089/ast.2009.0415. - DOI - PubMed
    1. Hughes-Fulford M. To infinity … and beyond! Human spaceflight and life science. FASEB J. 2011;25:2858–2864. doi: 10.1096/fj.11-0902ufm. - DOI - PMC - PubMed
    1. Bradbury P., Wu H., Choi J.U., Rowan A.E., Zhang H., Poole K., Lauko J., Chou J. Modeling the Impact of Microgravity at the Cellular Level: Implications for Human Disease. Front. Cell Dev. Biol. 2020;8:96. doi: 10.3389/fcell.2020.00096. - DOI - PMC - PubMed
    1. Vandenbrink J.P., Kiss J.Z. Space, the final frontier: A critical review of recent experiments performed in microgravity. Plant. Sci. 2016;243:115–119. doi: 10.1016/j.plantsci.2015.11.004. - DOI - PMC - PubMed
    1. Crucian B., Stowe R., Quiriarte H., Pierson D., Sams C. Monocyte phenotype and cytokine production profiles are dysregulated by short-duration spaceflight. Aviat. Space Environ. Med. 2011;82:857–862. doi: 10.3357/ASEM.3047.2011. - DOI - PubMed

LinkOut - more resources