

Multi-Modal Biological Destruction by Cold Atmospheric Plasma: Capability and Mechanism
- PMID: 34572443
- PMCID: PMC8465976
- DOI: 10.3390/biomedicines9091259
Multi-Modal Biological Destruction by Cold Atmospheric Plasma: Capability and Mechanism
Abstract
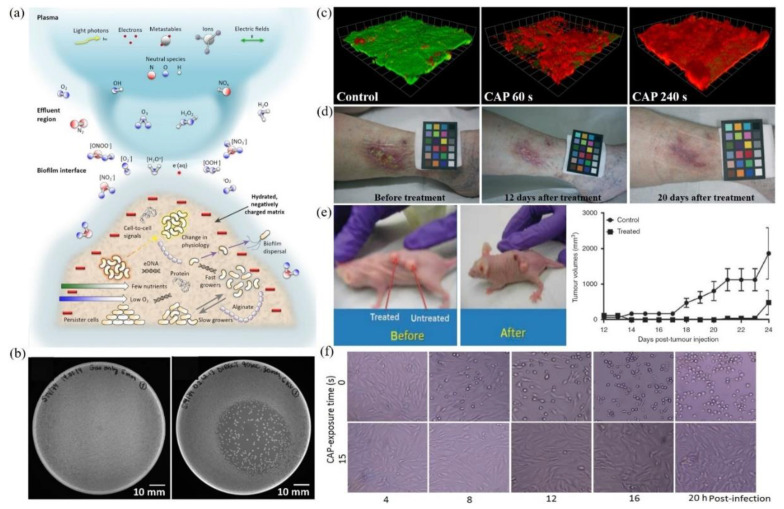
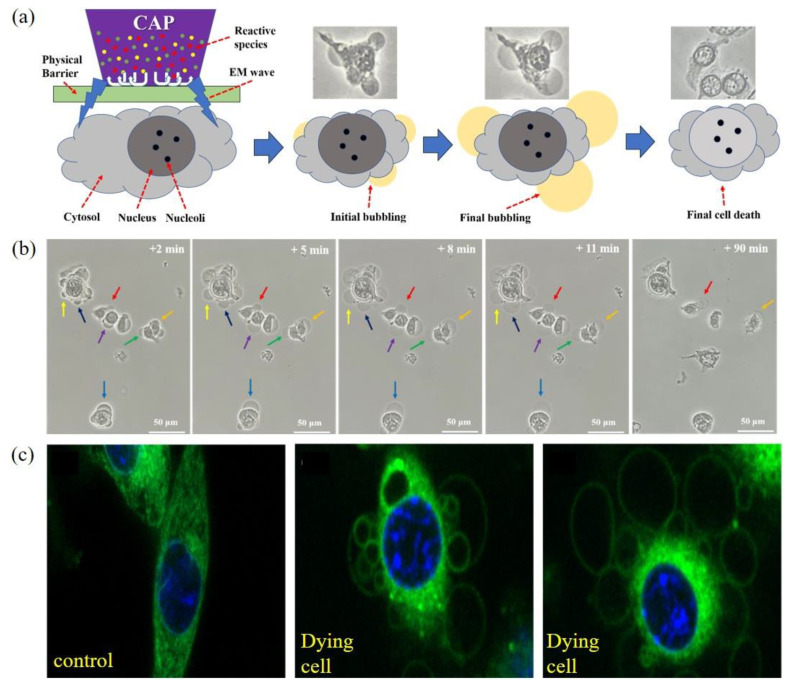
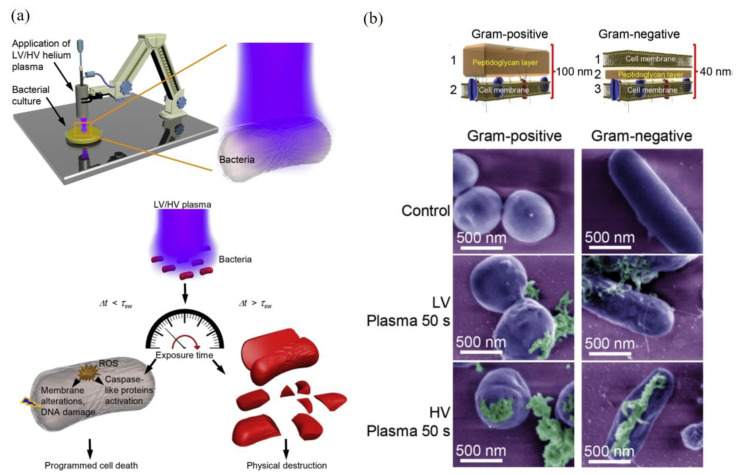
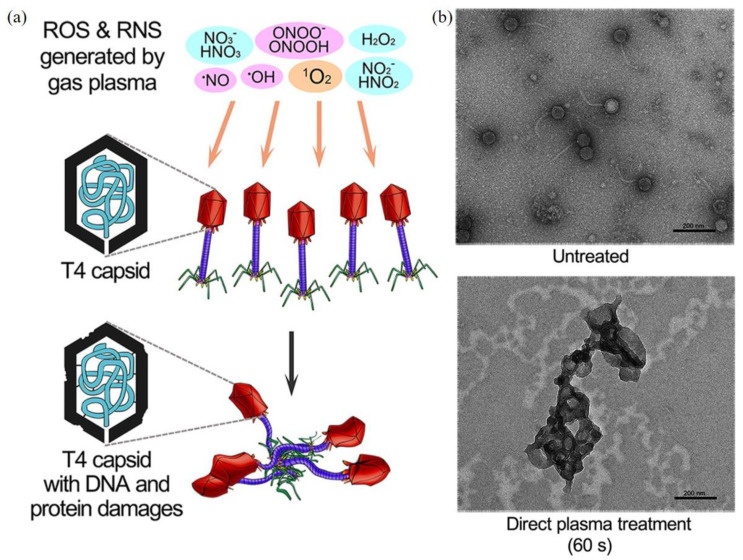
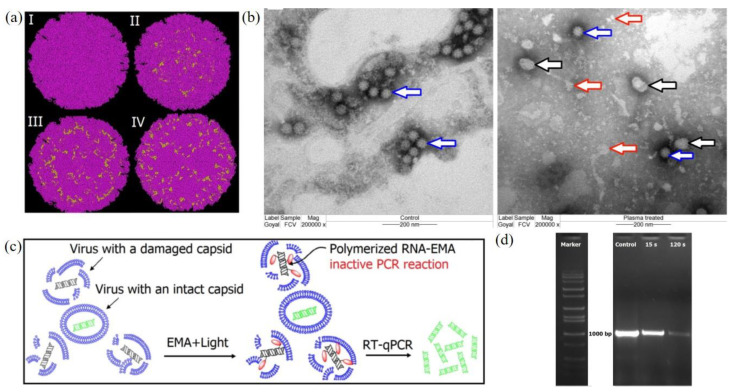
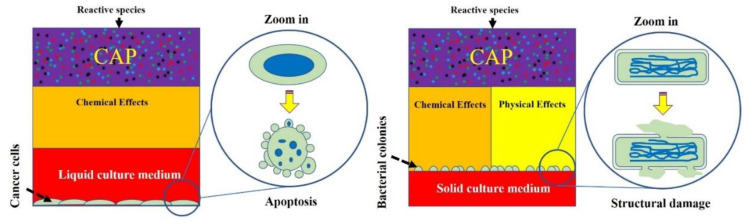
Cold atmospheric plasma (CAP) is a near-room-temperature, partially ionized gas composed of reactive neutral and charged species. CAP also generates physical factors, including ultraviolet (UV) radiation and thermal and electromagnetic (EM) effects. Studies over the past decade demonstrated that CAP could effectively induce death in a wide range of cell types, from mammalian to bacterial cells. Viruses can also be inactivated by a CAP treatment. The CAP-triggered cell-death types mainly include apoptosis, necrosis, and autophagy-associated cell death. Cell death and virus inactivation triggered by CAP are the foundation of the emerging medical applications of CAP, including cancer therapy, sterilization, and wound healing. Here, we systematically analyze the entire picture of multi-modal biological destruction by CAP treatment and their underlying mechanisms based on the latest discoveries particularly the physical effects on cancer cells.
Keywords: cancer therapy; cell death; cold atmospheric plasma; microorganism sterilization; virus inactivation.
Conflict of interest statement
The authors declare no conflict of interest.
Figures
Similar articles
-
Preclinical Cold Atmospheric Plasma Cancer Treatment.Cancers (Basel). 2022 Jul 16;14(14):3461. doi: 10.3390/cancers14143461. Cancers (Basel). 2022. PMID: 35884523 Free PMC article. Review.
-
Cold Atmospheric Plasma Targeting Hematological Malignancies: Potentials and Problems of Clinical Translation.Antioxidants (Basel). 2022 Aug 17;11(8):1592. doi: 10.3390/antiox11081592. Antioxidants (Basel). 2022. PMID: 36009311 Free PMC article. Review.
-
A Physically Triggered Cell Death via Transbarrier Cold Atmospheric Plasma Cancer Treatment.ACS Appl Mater Interfaces. 2020 Aug 5;12(31):34548-34563. doi: 10.1021/acsami.0c06500. Epub 2020 Jul 23. ACS Appl Mater Interfaces. 2020. PMID: 32648738
-
The anti-glioblastoma effect of cold atmospheric plasma treatment: physical pathway v.s. chemical pathway.Sci Rep. 2020 Jul 16;10(1):11788. doi: 10.1038/s41598-020-68585-z. Sci Rep. 2020. PMID: 32678153 Free PMC article.
-
The Strong Cell-based Hydrogen Peroxide Generation Triggered by Cold Atmospheric Plasma.Sci Rep. 2017 Sep 7;7(1):10831. doi: 10.1038/s41598-017-11480-x. Sci Rep. 2017. PMID: 28883477 Free PMC article.
Cited by
-
Preclinical Cold Atmospheric Plasma Cancer Treatment.Cancers (Basel). 2022 Jul 16;14(14):3461. doi: 10.3390/cancers14143461. Cancers (Basel). 2022. PMID: 35884523 Free PMC article. Review.
-
The Molecular Basis for Selectivity of the Cytotoxic Response of Lung Adenocarcinoma Cells to Cold Atmospheric Plasma.Biomolecules. 2023 Nov 20;13(11):1672. doi: 10.3390/biom13111672. Biomolecules. 2023. PMID: 38002354 Free PMC article.
-
Reduced Staphylococcus Abundance Characterizes the Lesional Microbiome of Actinic Keratosis Patients after Field-Directed Therapies.Microbiol Spectr. 2023 Jun 15;11(3):e0440122. doi: 10.1128/spectrum.04401-22. Epub 2023 May 22. Microbiol Spectr. 2023. PMID: 37212689 Free PMC article.
-
Toxicity and virucidal activity of a neon-driven micro plasma jet on eukaryotic cells and a coronavirus.Free Radic Biol Med. 2022 Oct;191:105-118. doi: 10.1016/j.freeradbiomed.2022.08.026. Epub 2022 Aug 28. Free Radic Biol Med. 2022. PMID: 36041652 Free PMC article.
-
Cold Atmospheric Plasma Targeting Hematological Malignancies: Potentials and Problems of Clinical Translation.Antioxidants (Basel). 2022 Aug 17;11(8):1592. doi: 10.3390/antiox11081592. Antioxidants (Basel). 2022. PMID: 36009311 Free PMC article. Review.
References
-
- Phelps A.V., Petrovic Z.L. Cold-cathode discharges and breakdown in argon: Surface and gas phase production of secondary electrons. Plasma Sources Sci. Technol. 1999;8:R21–R44. doi: 10.1088/0963-0252/8/3/201. - DOI
-
- Conrads H., Schmidt M. Plasma generation and plasma Sources. Plasma Sources Sci. Technol. 2000;9:441–454. doi: 10.1088/0963-0252/9/4/301. - DOI
-
- Fridman A., Chirokov A., Gutsol A. Non-thermal atmospheric pressure discharges. J. Phys. D Appl. Phys. 2005;38:R1. doi: 10.1088/0022-3727/38/2/R01. - DOI
-
- Tendero C., Tixier C., Tristant P., Desmaison J., Leprince P. Atmospheric pressure plasmas: A review. Spectrochim. Acta-Part B At. Spectrosc. 2006;61:2–30. doi: 10.1016/j.sab.2005.10.003. - DOI
Publication types
Grants and funding
LinkOut - more resources
Full Text Sources
Miscellaneous
