

Design and Prototyping of Genetically Encoded Arsenic Biosensors Based on Transcriptional Regulator AfArsR
- PMID: 34572489
- PMCID: PMC8470949
- DOI: 10.3390/biom11091276
Design and Prototyping of Genetically Encoded Arsenic Biosensors Based on Transcriptional Regulator AfArsR
Abstract
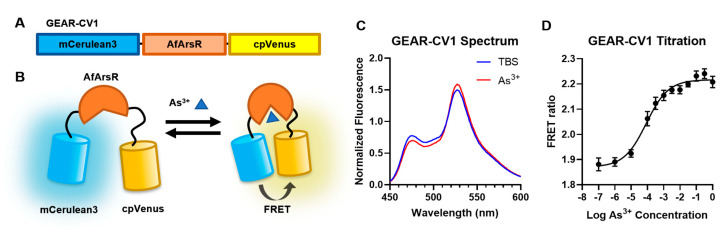
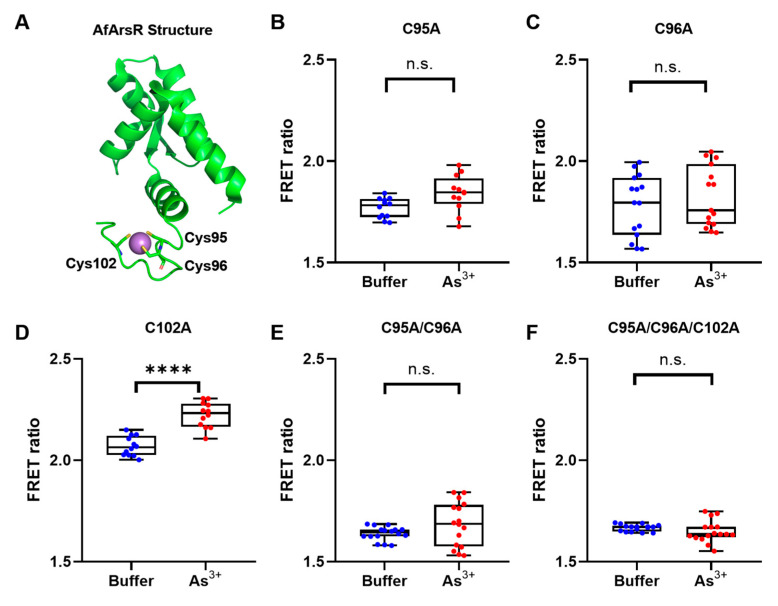
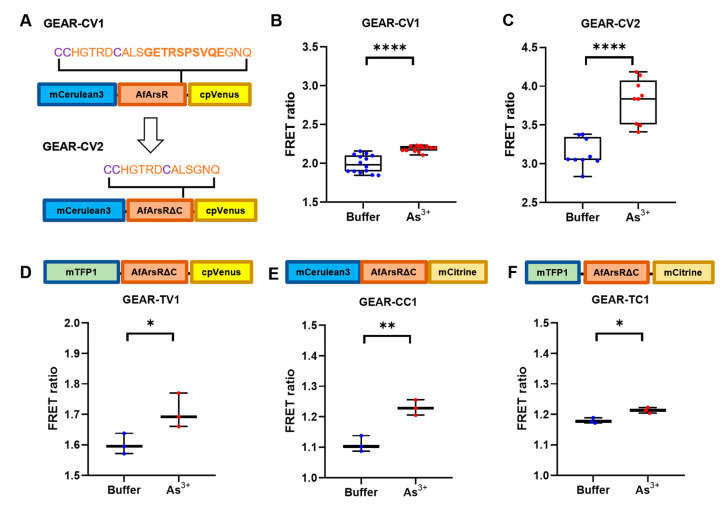
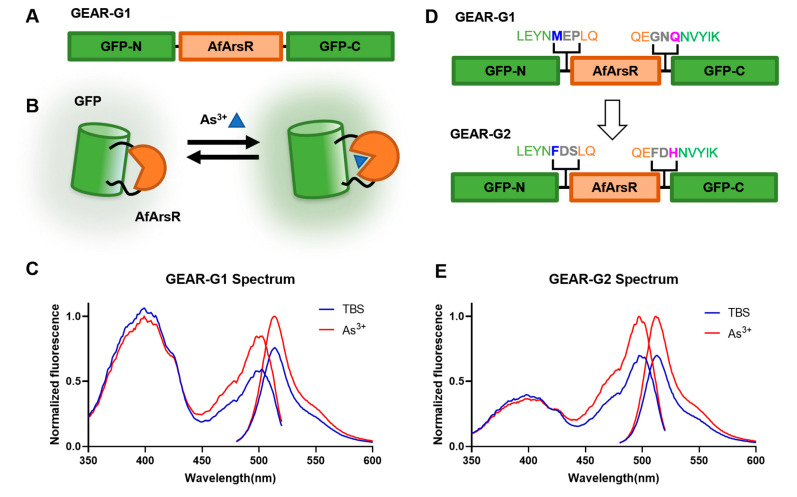
Genetically encoded biosensors based on engineered fluorescent proteins (FPs) are essential tools for monitoring the dynamics of specific ions and molecules in biological systems. Arsenic ion in the +3 oxidation state (As3+) is highly toxic to cells due to its ability to bind to protein thiol groups, leading to inhibition of protein function, disruption of protein-protein interactions, and eventually to cell death. A genetically encoded biosensor for the detection of As3+ could potentially facilitate the investigation of such toxicity both in vitro and in vivo. Here, we designed and developed two prototype genetically encoded arsenic biosensors (GEARs), based on a bacterial As3+ responsive transcriptional factor AfArsR from Acidithiobacillus ferrooxidans. We constructed FRET-based GEAR biosensors by insertion of AfArsR between FP acceptor/donor FRET pairs. We further designed and engineered single FP-based GEAR biosensors by insertion of AfArsR into GFP. These constructs represent prototypes for a new family of biosensors based on the ArsR transcriptional factor scaffold. Further improvements of the GEAR biosensor family could lead to variants with suitable performance for detection of As3+ in various biological and environmental systems.
Keywords: FRET and FP-based arsenic biosensors; arsenic biosensors (GEARs); genetically encoded biosensor.
Conflict of interest statement
The authors declare no conflict of interest.
Figures
Similar articles
-
Genetically Encoded Biosensors Based on Fluorescent Proteins.Sensors (Basel). 2021 Jan 25;21(3):795. doi: 10.3390/s21030795. Sensors (Basel). 2021. PMID: 33504068 Free PMC article. Review.
-
Booster, a Red-Shifted Genetically Encoded Förster Resonance Energy Transfer (FRET) Biosensor Compatible with Cyan Fluorescent Protein/Yellow Fluorescent Protein-Based FRET Biosensors and Blue Light-Responsive Optogenetic Tools.ACS Sens. 2020 Mar 27;5(3):719-730. doi: 10.1021/acssensors.9b01941. Epub 2020 Feb 26. ACS Sens. 2020. PMID: 32101394
-
Paralogous Regulators ArsR1 and ArsR2 of Pseudomonas putida KT2440 as a Basis for Arsenic Biosensor Development.Appl Environ Microbiol. 2016 Jun 30;82(14):4133-4144. doi: 10.1128/AEM.00606-16. Print 2016 Jul 15. Appl Environ Microbiol. 2016. PMID: 27208139 Free PMC article.
-
Monitoring arsenic using genetically encoded biosensors in vitro: The role of evolved regulatory genes.Ecotoxicol Environ Saf. 2021 Jan 1;207:111273. doi: 10.1016/j.ecoenv.2020.111273. Epub 2020 Sep 8. Ecotoxicol Environ Saf. 2021. PMID: 32916524
-
Unravelling molecular dynamics in living cells: Fluorescent protein biosensors for cell biology.J Microsc. 2025 May;298(2):123-184. doi: 10.1111/jmi.13270. Epub 2024 Feb 15. J Microsc. 2025. PMID: 38357769 Review.
Cited by
-
Fluorescent Indicators For Biological Imaging of Monatomic Ions.Front Cell Dev Biol. 2022 Apr 27;10:885440. doi: 10.3389/fcell.2022.885440. eCollection 2022. Front Cell Dev Biol. 2022. PMID: 35573682 Free PMC article. Review.
-
Editorial for the Special Issue: "State-of-Art in Protein Engineering".Biomolecules. 2022 Jul 10;12(7):966. doi: 10.3390/biom12070966. Biomolecules. 2022. PMID: 35883522 Free PMC article.
-
Insilico discovery of novel Phosphodiesterase 4 (PDE4) inhibitors for the treatment of psoriasis: Insights from computer aided drug design approaches.PLoS One. 2024 Nov 13;19(11):e0305934. doi: 10.1371/journal.pone.0305934. eCollection 2024. PLoS One. 2024. PMID: 39535988 Free PMC article.
-
Bacterial Metallostasis: Metal Sensing, Metalloproteome Remodeling, and Metal Trafficking.Chem Rev. 2024 Dec 25;124(24):13574-13659. doi: 10.1021/acs.chemrev.4c00264. Epub 2024 Dec 10. Chem Rev. 2024. PMID: 39658019 Free PMC article. Review.
-
Exploration of small molecules as inhibitors of potential BACE1 protein to treat amyloid cerebrovascular disease by employing molecular modeling and simulation approaches.PLoS One. 2025 Mar 21;20(3):e0317716. doi: 10.1371/journal.pone.0317716. eCollection 2025. PLoS One. 2025. PMID: 40117242 Free PMC article.
References
Publication types
MeSH terms
Substances
Supplementary concepts
LinkOut - more resources
Full Text Sources
Medical
Research Materials
Miscellaneous
