

Effect of Strain Rate on Single Tau, Dimerized Tau and Tau-Microtubule Interface: A Molecular Dynamics Simulation Study
- PMID: 34572521
- PMCID: PMC8472149
- DOI: 10.3390/biom11091308
Effect of Strain Rate on Single Tau, Dimerized Tau and Tau-Microtubule Interface: A Molecular Dynamics Simulation Study
Abstract
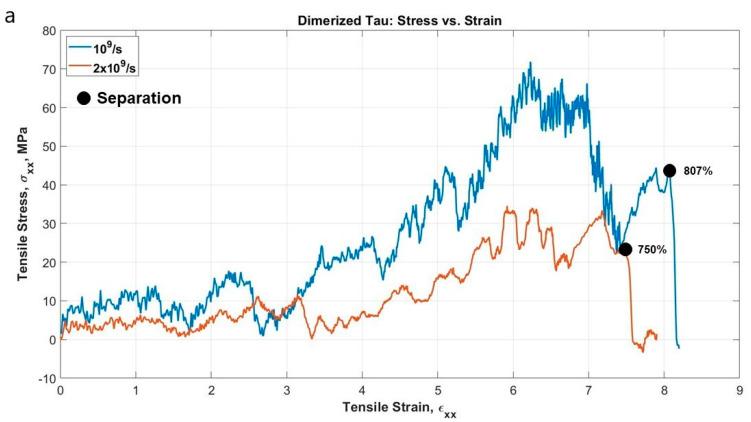
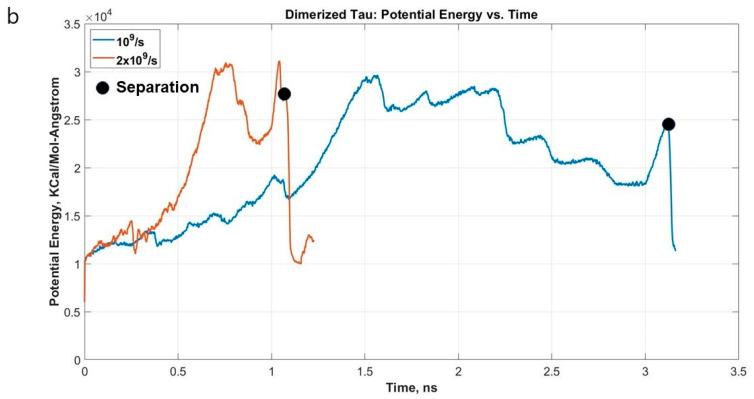
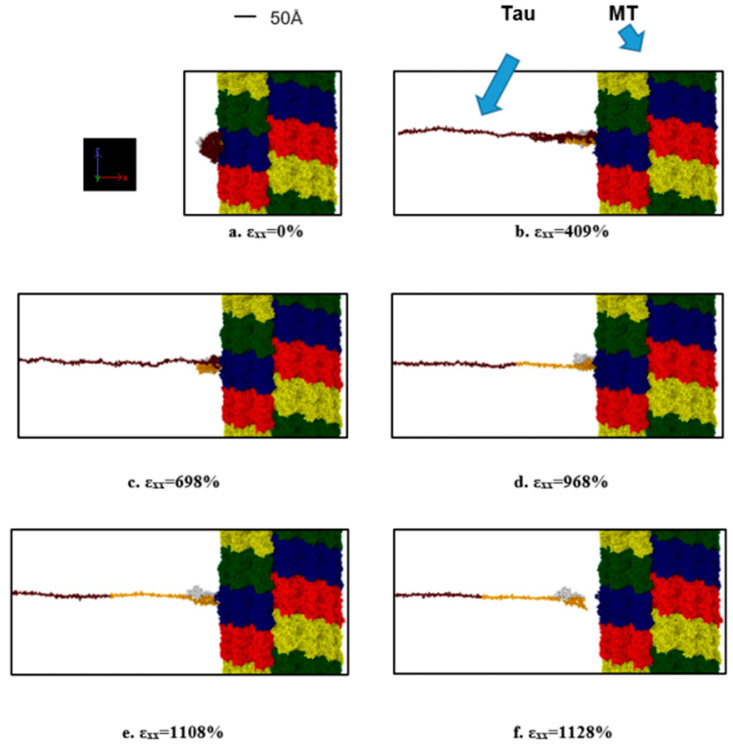
Microtubule-associated protein (MAP) tau is a cross-linking molecule that provides structural stability to axonal microtubules (MT). It is considered a potential biomarker for Alzheimer's disease (AD), dementia, and other neurological disorders. It is also a signature protein for Traumatic Brain Injury (TBI) assessment. In the case of TBI, extreme dynamic mechanical energies can be felt by the axonal cytoskeletal members. As such, fundamental understandings of the responses of single tau protein, polymerized tau protein, and tau-microtubule interfaces under high-rate mechanical forces are important. This study attempts to determine the high-strain rate mechanical behavior of single tau, dimerized tau, and tau-MT interface using molecular dynamics (MD) simulation. The results show that a single tau protein is a highly stretchable soft polymer. During deformation, first, it significantly unfolds against van der Waals and electrostatic bonds. Then it stretches against strong covalent bonds. We found that tau acts as a viscoelastic material, and its stiffness increases with the strain rate. The unfolding stiffness can be ~50-500 MPa, while pure stretching stiffness can be >2 GPa. The dimerized tau model exhibits similar behavior under similar strain rates, and tau sliding from another tau is not observed until it is stretched to >7 times of original length, depending on the strain rate. The tau-MT interface simulations show that very high strain and strain rates are required to separate tau from MT suggesting Tau-MT bonding is stronger than MT subunit bonding between themselves. The dimerized tau-MT interface simulations suggest that tau-tau bonding is stronger than tau-MT bonding. In summary, this study focuses on the structural response of individual cytoskeletal components, namely microtubule (MT) and tau protein. Furthermore, we consider not only the individual response of a component, but also their interaction with each other (such as tau with tau or tau with MT). This study will eventually pave the way to build a bottom-up multiscale brain model and analyze TBI more comprehensively.
Keywords: axonal cytoskeleton; high strain rate; molecular dynamics; tau protein.
Conflict of interest statement
The authors declare no competing interest.
Figures


Similar articles
-
Domain focused and residue focused phosphorylation effect on tau protein: A molecular dynamics simulation study.J Mech Behav Biomed Mater. 2021 Jan;113:104149. doi: 10.1016/j.jmbbm.2020.104149. Epub 2020 Oct 21. J Mech Behav Biomed Mater. 2021. PMID: 33125954
-
Mechanical Effects of Dynamic Binding between Tau Proteins on Microtubules during Axonal Injury.Biophys J. 2015 Dec 1;109(11):2328-37. doi: 10.1016/j.bpj.2015.09.010. Biophys J. 2015. PMID: 26636944 Free PMC article.
-
The Microtubule-Associated Protein Tau Mediates the Organization of Microtubules and Their Dynamic Exploration of Actin-Rich Lamellipodia and Filopodia of Cortical Growth Cones.J Neurosci. 2018 Jan 10;38(2):291-307. doi: 10.1523/JNEUROSCI.2281-17.2017. Epub 2017 Nov 22. J Neurosci. 2018. PMID: 29167405 Free PMC article.
-
Activity-dependent neuroprotective protein (ADNP)-end-binding protein (EB) interactions regulate microtubule dynamics toward protection against tauopathy.Prog Mol Biol Transl Sci. 2021;177:65-90. doi: 10.1016/bs.pmbts.2020.07.008. Epub 2020 Aug 14. Prog Mol Biol Transl Sci. 2021. PMID: 33453943 Review.
-
Tau and axonopathy in neurodegenerative disorders.Neuromolecular Med. 2002;2(2):131-50. doi: 10.1385/NMM:2:2:131. Neuromolecular Med. 2002. PMID: 12428808 Review.
Cited by
-
Shock-Induced Damage Mechanism of Perineuronal Nets.Biomolecules. 2021 Dec 22;12(1):10. doi: 10.3390/biom12010010. Biomolecules. 2021. PMID: 35053158 Free PMC article.
-
Mechanical behavior of actin and spectrin subjected to high strain rate: A molecular dynamics simulation study.Comput Struct Biotechnol J. 2021 Mar 26;19:1738-1749. doi: 10.1016/j.csbj.2021.03.026. eCollection 2021. Comput Struct Biotechnol J. 2021. PMID: 33897978 Free PMC article.
-
A mechanical model for lateral and axial impacts and quantification of effect on viability of SHSY5Y neuroblastoma cells.Sci Rep. 2025 Jun 3;15(1):19353. doi: 10.1038/s41598-025-02165-x. Sci Rep. 2025. PMID: 40456811 Free PMC article.
-
Gastrodin Alleviates Tau Pathology by Targeting the Alzheimer's Risk Gene FERMT2, Reversing the Reduction in Brain Viscoelasticity.CNS Neurosci Ther. 2025 Mar;31(3):e70283. doi: 10.1111/cns.70283. CNS Neurosci Ther. 2025. PMID: 40119586 Free PMC article.
-
Viscoelastic damage evaluation of the axon.Front Bioeng Biotechnol. 2022 Oct 6;10:904818. doi: 10.3389/fbioe.2022.904818. eCollection 2022. Front Bioeng Biotechnol. 2022. PMID: 36277388 Free PMC article.
References
-
- Wright R.M. Ph.D. Thesis. The Johns Hopkins University; Baltimore, MD, USA: Jan, 2012. A Computational Model for Traumatic Brain Injury Based on an Axonal Injury Criterion.
Publication types
MeSH terms
Substances
LinkOut - more resources
Full Text Sources
Research Materials
