

Common Metabolites in Two Different Hypertensive Mouse Models: A Serum and Urine Metabolome Study
- PMID: 34572600
- PMCID: PMC8467937
- DOI: 10.3390/biom11091387
Common Metabolites in Two Different Hypertensive Mouse Models: A Serum and Urine Metabolome Study
Abstract
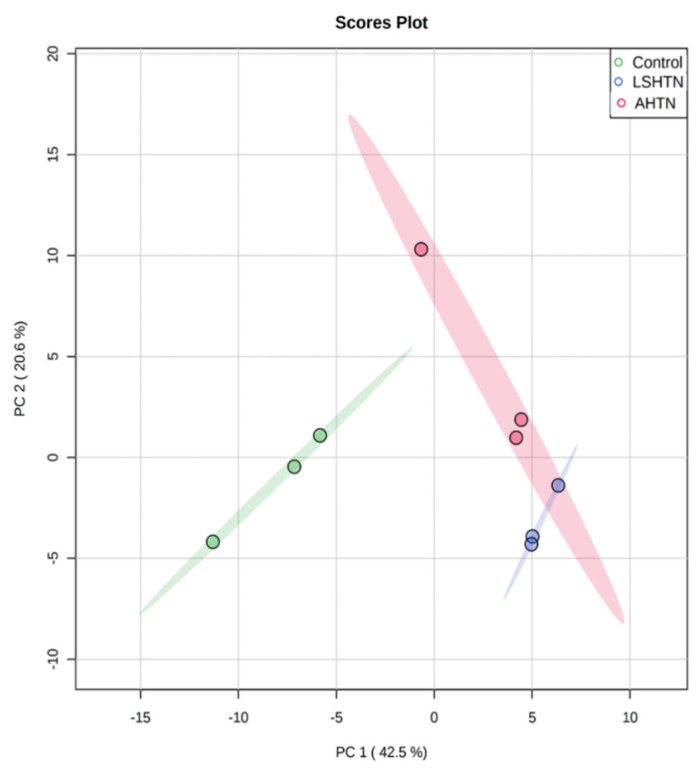
Recent metabolomics studies have identified a wide array of microbial metabolites and metabolite pathways that are significantly altered in hypertension. However, whether these metabolites play an active role in pathogenesis of hypertension or are altered because of this has yet to be determined. In the current study, we hypothesized that metabolite changes common between hypertension models may unify hypertension's pathophysiology with respect to metabolites. We utilized two common mouse models of experimental hypertension: L-arginine methyl ester hydrochloride (L-NAME)/high-salt-diet-induced hypertension (LSHTN) and angiotensin II induced hypertension (AHTN). To identify common metabolites that were altered across both models, we performed untargeted global metabolomics analysis in serum and urine and the resulting data were analyzed using MetaboAnalyst software and compared to control mice. A total of 41 serum metabolites were identified as being significantly altered in any hypertensive model compared to the controls. Of these compounds, 14 were commonly changed in both hypertensive groups, with 4 significantly increased and 10 significantly decreased. In the urine, six metabolites were significantly altered in any hypertensive group with respect to the control; however, none of them were common between the hypertensive groups. These findings demonstrate that a modest, but potentially important, number of serum metabolites are commonly altered between experimental hypertension models. Further studies of the newly identified metabolites from this untargeted metabolomics analysis may lead to a greater understanding of the association between gut dysbiosis and hypertension.
Keywords: angiotensin II; hypertension; metabolomics; microbial metabolites; salt.
Conflict of interest statement
R.C.A. and A.J. have filed patents on the use of tryptophan metabolites in disease and own equity in Tlaloc Therapeutics. The other authors declare no conflict of interest.
Figures


References
-
- Whelton P.K., Carey R.M., Aronow W.S., Casey D.E., Jr., Collins K.J., Dennison Himmelfarb C., DePalma S.M., Gidding S., Jamerson K.A., Jones D.W., et al. 2017 ACC/AHA/AAPA/ABC/ACPM/AGS/APhA/ASH/ASPC/NMA/PCNA Guideline for the Prevention, Detection, Evaluation, and Management of High Blood Pressure in Adults: A Report of the American College of Cardiology/American Heart Association Task Force on Clinical Practice Guidelines. Hypertension. 2018;71:e13–e115. - PubMed
-
- Natarajan N., Hori D., Flavahan S., Steppan J., Flavahan N.A., Berkowitz D.E., Pluznick J.L. Microbial short chain fatty acid metabolites lower blood pressure via endothelial G protein-coupled receptor 41. Physiol. Genom. 2016;48:826–834. doi: 10.1152/physiolgenomics.00089.2016. - DOI - PMC - PubMed
