

Erlotinib Promotes Ligand-Induced EGFR Degradation in 3D but Not 2D Cultures of Pancreatic Ductal Adenocarcinoma Cells
- PMID: 34572731
- PMCID: PMC8470972
- DOI: 10.3390/cancers13184504
Erlotinib Promotes Ligand-Induced EGFR Degradation in 3D but Not 2D Cultures of Pancreatic Ductal Adenocarcinoma Cells
Abstract
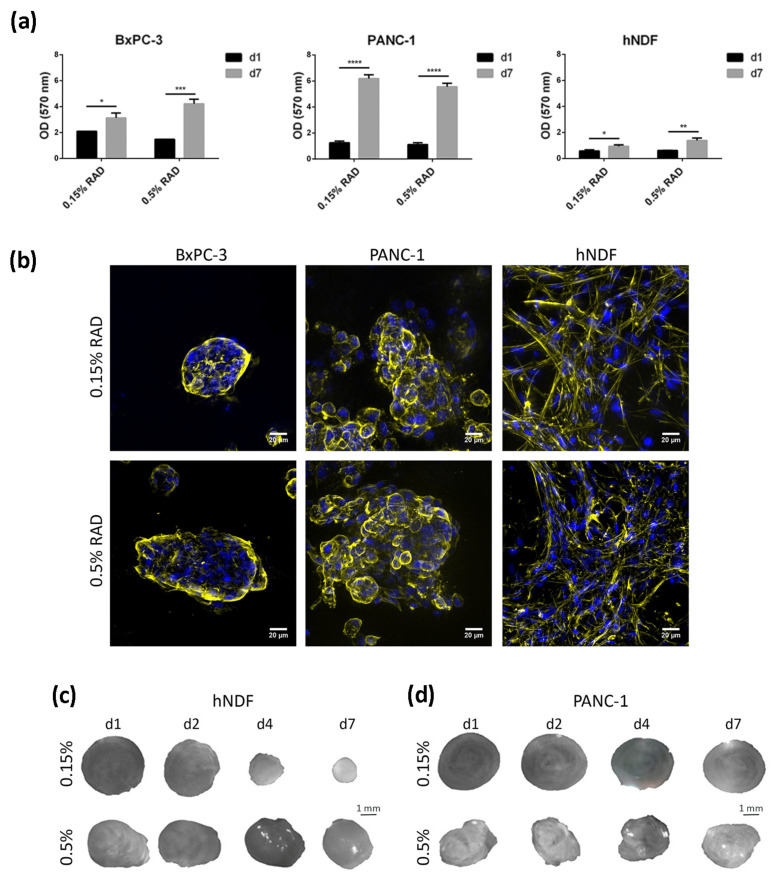
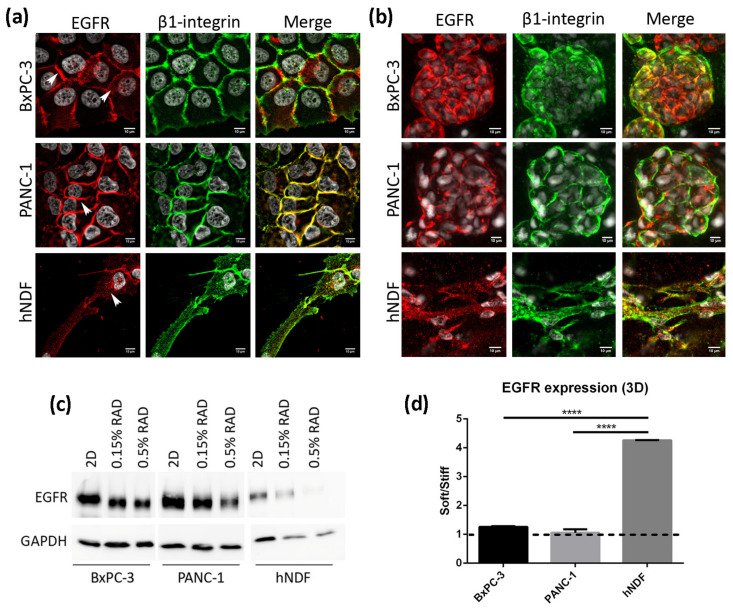
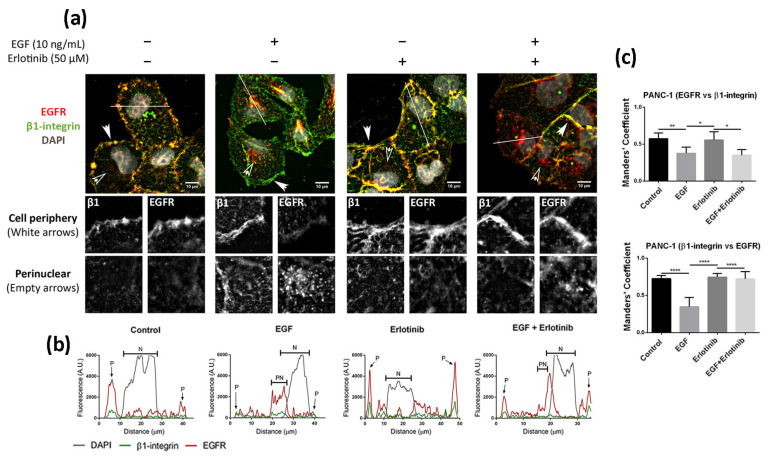
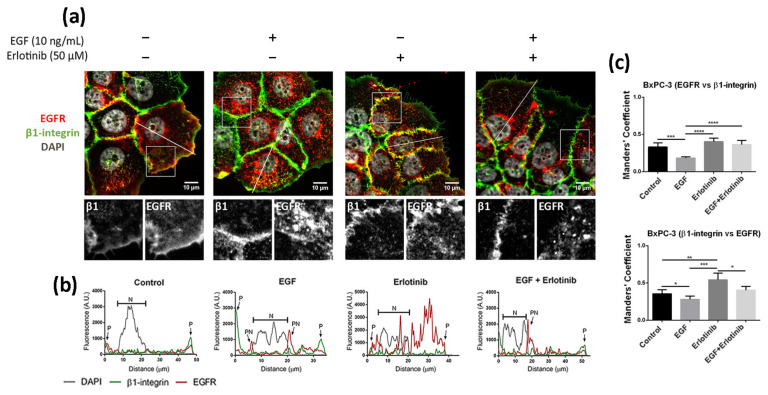
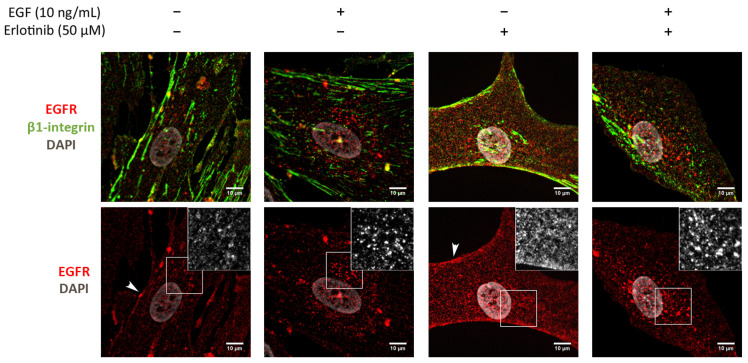
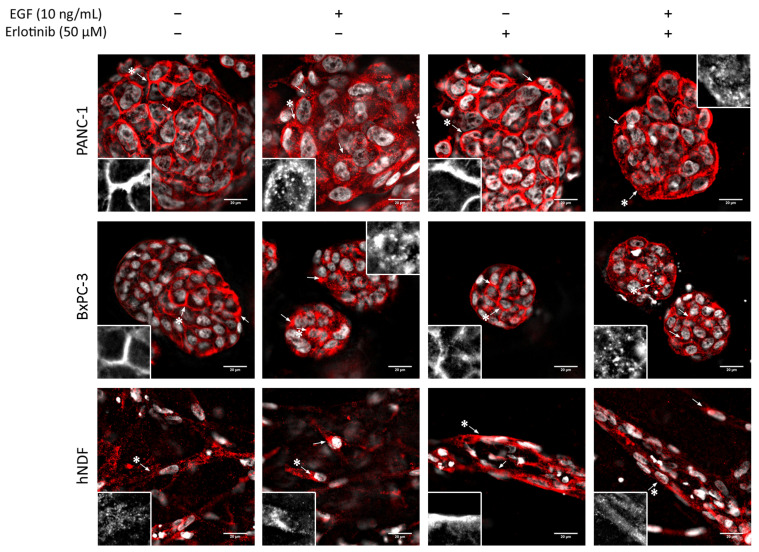
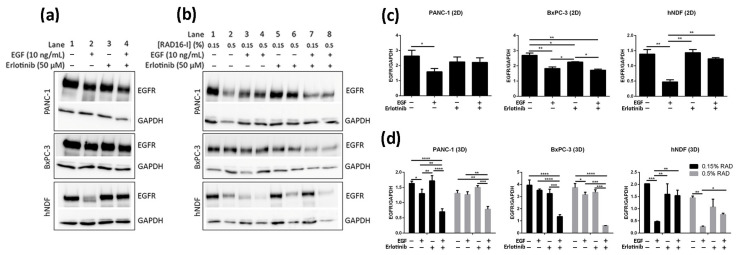
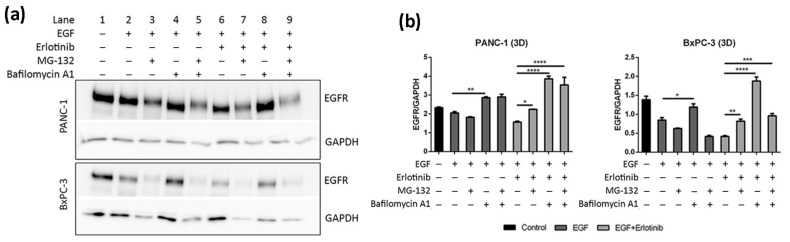
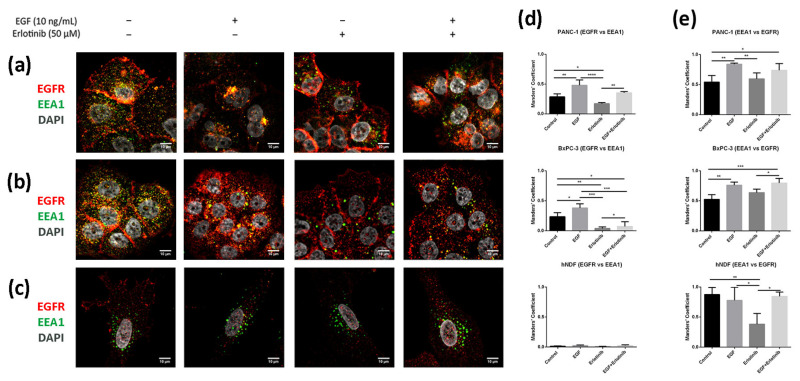
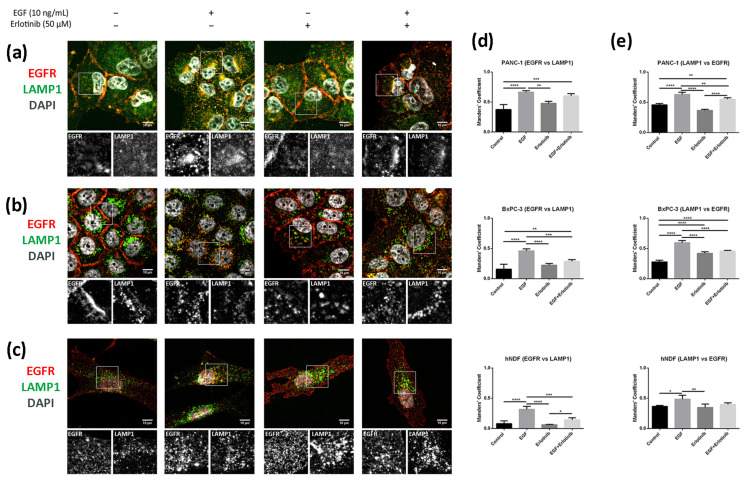
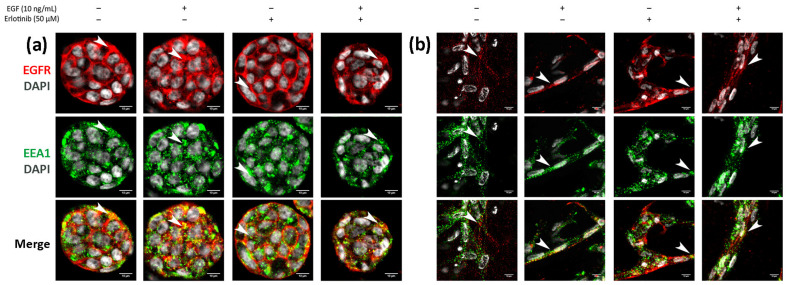
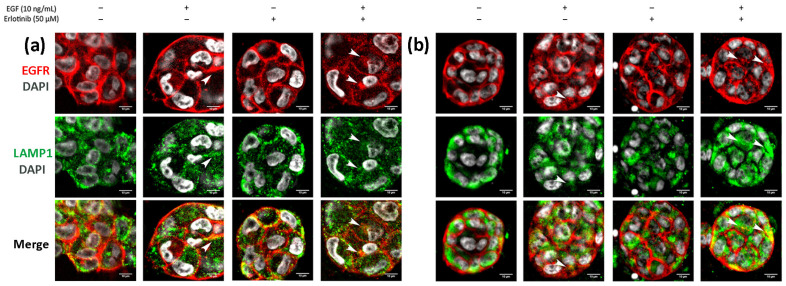
The epithelial growth factor receptor (EGFR) is a tyrosine kinase receptor that participates in many biological processes such as cell proliferation. In addition, EGFR is overexpressed in many epithelial cancers and therefore is a target for cancer therapy. Moreover, EGFR responds to lots of stimuli by internalizing into endosomes from where it can be recycled to the membrane or further sorted into lysosomes where it undergoes degradation. Two-dimensional cell cultures have been classically used to study EGFR trafficking mechanisms in cancer cells. However, it has been widely demonstrated that in 2D cultures cells are exposed to a non-physiological environment as compared to 3D cultures that provide the normal cellular conformation, matrix dimensionality and stiffness, as well as molecular gradients. Therefore, the microenvironment of solid tumors is better recreated in 3D culture models, and this is why they are becoming a more physiological alternative to study cancer physiology. Here, we develop a new model of EGFR internalization and degradation upon erlotinib treatment in pancreatic ductal adenocarcinoma (PDAC) cells cultured in a 3D self-assembling peptide scaffold. In this work, we show that treatment with the tyrosine kinase inhibitor erlotinib promotes EGFR degradation in 3D cultures of PDAC cell lines but not in 2D cultures. We also show that this receptor degradation does not occur in normal fibroblast cells, regardless of culture dimensionality. In conclusion, we demonstrate not only that erlotinib has a distinct effect on tumor and normal cells but also that pancreatic ductal adenocarcinoma cells respond differently to drug treatment when cultured in a 3D microenvironment. This study highlights the importance of culture systems that can more accurately mimic the in vivo tumor physiology.
Keywords: 3D culture; EGFR; PDAC; degradation; drug resistance; pancreatic ductal adenocarcinoma; self-assembling peptides; trafficking.
Conflict of interest statement
The authors declare no conflict of interest.
Figures
Similar articles
-
Increased Stiffness Downregulates Focal Adhesion Kinase Expression in Pancreatic Cancer Cells Cultured in 3D Self-Assembling Peptide Scaffolds.Biomedicines. 2022 Jul 29;10(8):1835. doi: 10.3390/biomedicines10081835. Biomedicines. 2022. PMID: 36009384 Free PMC article.
-
Assessment of different 3D culture systems to study tumor phenotype and chemosensitivity in pancreatic ductal adenocarcinoma.Int J Oncol. 2016 Jul;49(1):243-52. doi: 10.3892/ijo.2016.3513. Epub 2016 May 10. Int J Oncol. 2016. PMID: 27177201
-
Three-dimensional lung tumor microenvironment modulates therapeutic compound responsiveness in vitro--implication for drug development.PLoS One. 2014 Mar 17;9(3):e92248. doi: 10.1371/journal.pone.0092248. eCollection 2014. PLoS One. 2014. PMID: 24638075 Free PMC article.
-
Epidermal growth factor receptor-activating mutation(E746_T751>VP) in pancreatic ductal adenocarcinoma responds to erlotinib, followed by epidermal growth factor receptor resistance-mediating mutation (A647T): A case report and literature review.J Cancer Res Ther. 2020 Jul-Sep;16(4):950-954. doi: 10.4103/jcrt.JCRT_729_18. J Cancer Res Ther. 2020. PMID: 32930150 Review.
-
Epithelial and Mesenchymal Features of Pancreatic Ductal Adenocarcinoma Cell Lines in Two- and Three-Dimensional Cultures.J Pers Med. 2022 May 4;12(5):746. doi: 10.3390/jpm12050746. J Pers Med. 2022. PMID: 35629168 Free PMC article. Review.
Cited by
-
Increased Stiffness Downregulates Focal Adhesion Kinase Expression in Pancreatic Cancer Cells Cultured in 3D Self-Assembling Peptide Scaffolds.Biomedicines. 2022 Jul 29;10(8):1835. doi: 10.3390/biomedicines10081835. Biomedicines. 2022. PMID: 36009384 Free PMC article.
-
2D versus 3D tumor-on-chip models to study the impact of tumor organization on metabolic patterns in vitro.Sci Rep. 2025 Jun 4;15(1):19506. doi: 10.1038/s41598-025-03504-8. Sci Rep. 2025. PMID: 40461567 Free PMC article.
-
β-Sheet to Random Coil Transition in Self-Assembling Peptide Scaffolds Promotes Proteolytic Degradation.Biomolecules. 2022 Mar 7;12(3):411. doi: 10.3390/biom12030411. Biomolecules. 2022. PMID: 35327603 Free PMC article.
-
Mimicking the Complexity of Solid Tumors: How Spheroids Could Advance Cancer Preclinical Transformative Approaches.Cancers (Basel). 2025 Mar 30;17(7):1161. doi: 10.3390/cancers17071161. Cancers (Basel). 2025. PMID: 40227664 Free PMC article.
-
Biomaterial-Assisted 3D In Vitro Tumor Models: From Organoid towards Cancer Tissue Engineering Approaches.Cancers (Basel). 2023 Feb 14;15(4):1201. doi: 10.3390/cancers15041201. Cancers (Basel). 2023. PMID: 36831542 Free PMC article.
References
Grants and funding
LinkOut - more resources
Full Text Sources
Research Materials
Miscellaneous
