

You See What You Smell: Preferential Processing of Chemosensory Satiety Cues and Its Impact on Body Shape Perception
- PMID: 34573175
- PMCID: PMC8464758
- DOI: 10.3390/brainsci11091152
You See What You Smell: Preferential Processing of Chemosensory Satiety Cues and Its Impact on Body Shape Perception
Abstract
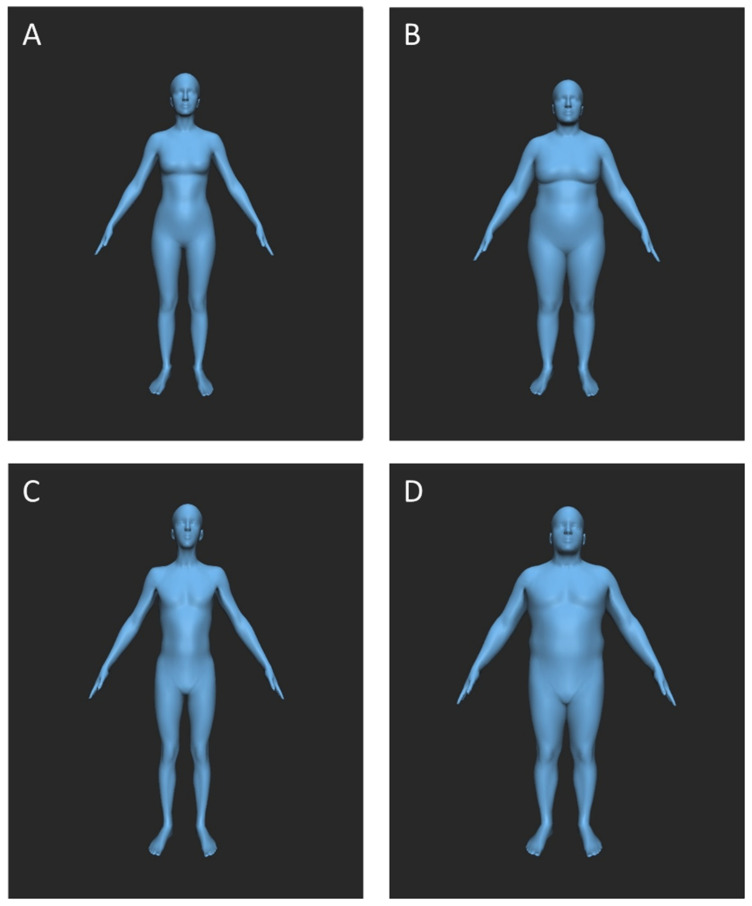
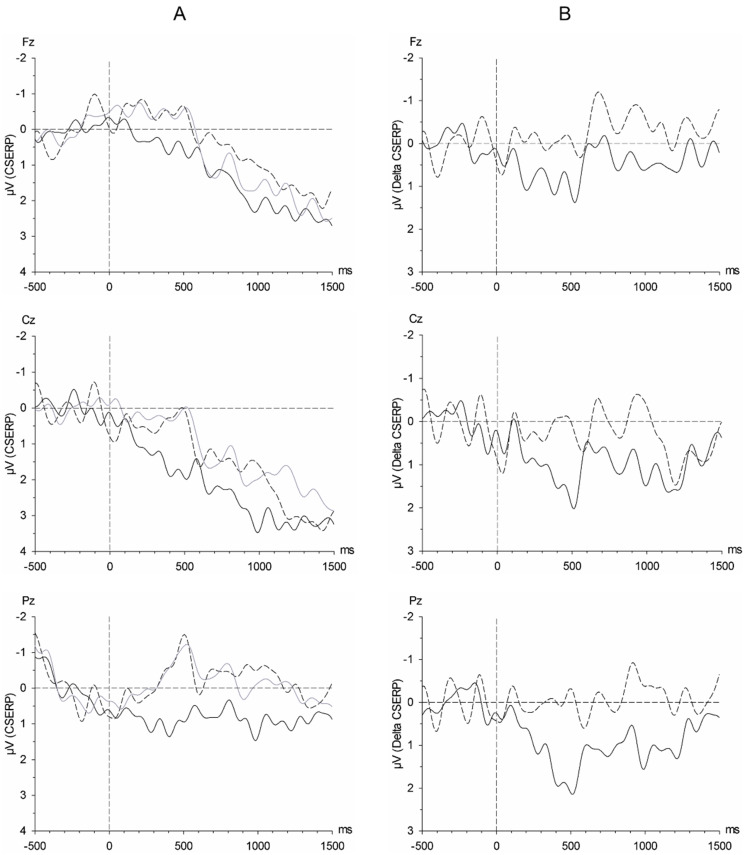
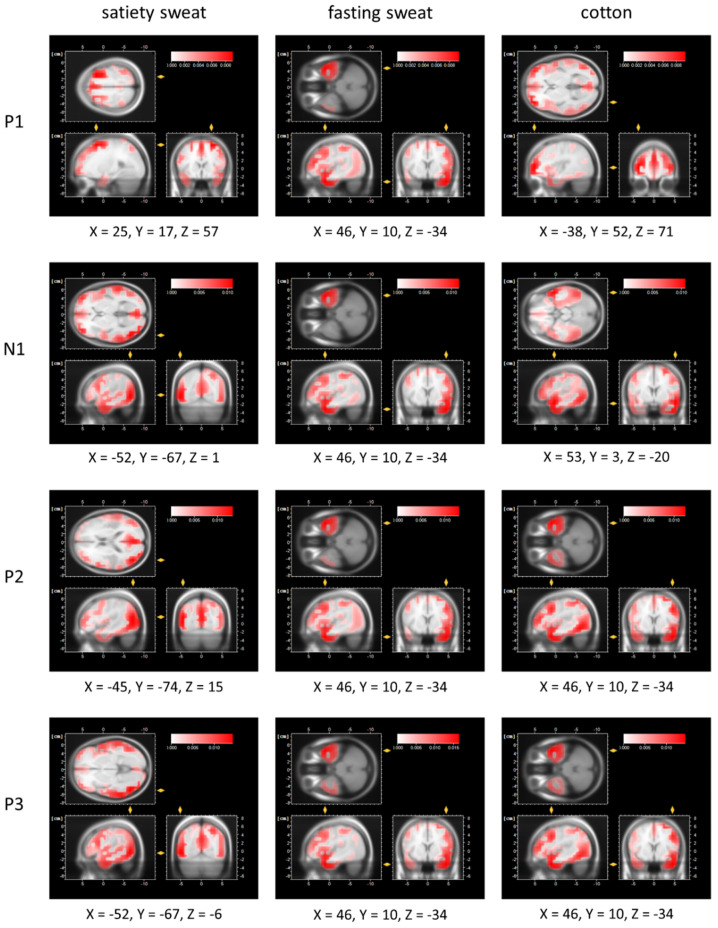
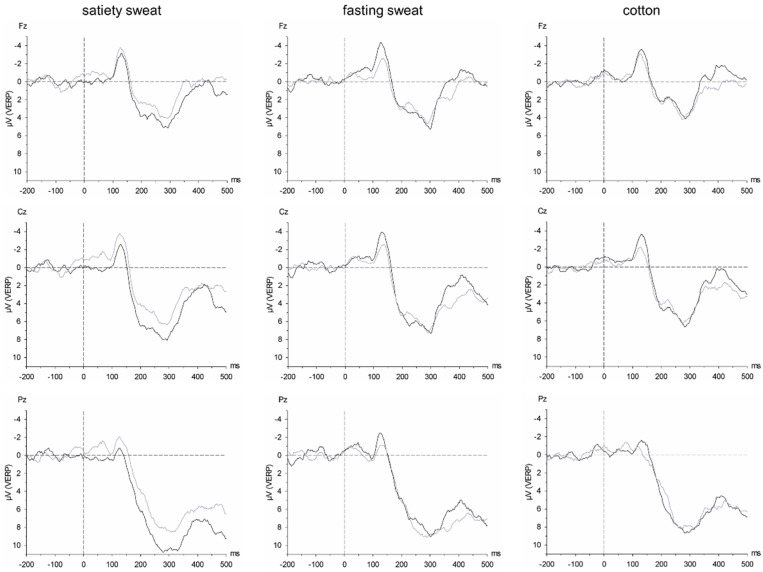
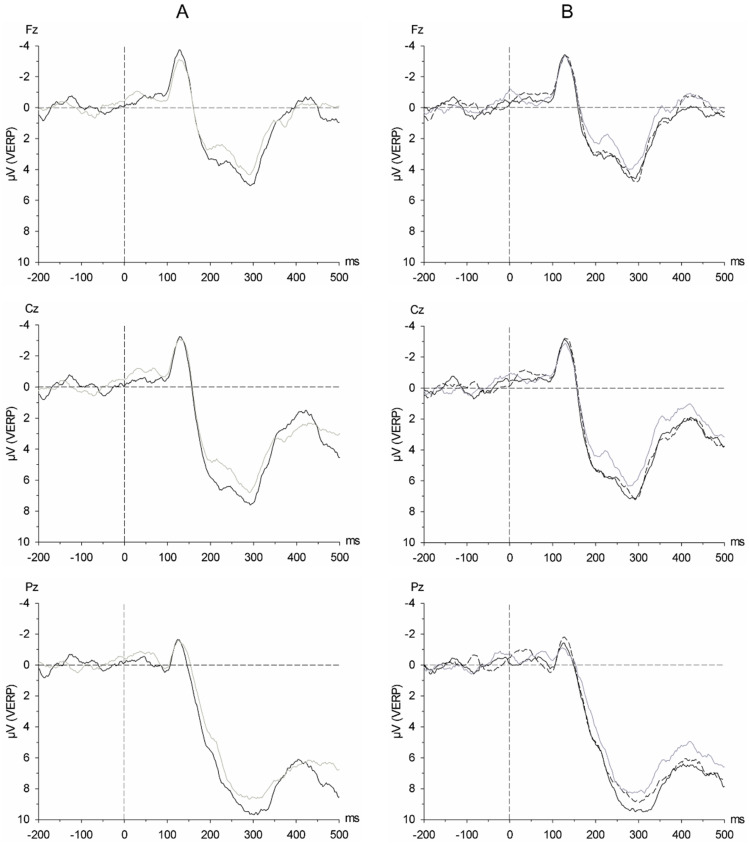
The current study examines neural responses to satiety- and fasting-related volatiles and their effect on the processing of body shapes. Axillary sweat was sampled with cotton pads from 10 individuals after 12 h of fasting, and after having consumed a standard breakfast. Pure cotton pads served as the control. The chemosensory stimuli were presented to 20 participants (via a constant-flow olfactometer) exclusively, and additionally as context to images of overweight and underweight avatars. EEG was recorded (61 electrodes), and chemosensory (CSERPs; P1, N1, P2, P3) and visual event-related potentials (VERPs; N1, P2, P3a, P3b) were analyzed. The amplitudes of all positive CSERP components differed more strongly from cotton in response to chemosensory satiety cues as compared to fasting cues (P1: p = 0.023, P2: p = 0.083, P3: p = 0.031), paralleled by activity within the middle frontal and temporal gyrus. Overweight compared to underweight body shapes tended to elicit larger VERP P2 amplitudes (p = 0.068), and chemosensory satiety cues amplified the VERP amplitudes in response to any body shape (P2, P3a, P3b; all ps ≤ 0.017) as compared to the cotton control. The results indicate that chemosensory satiety cues transmit complex social information, overriding the processing of analogous visual input.
Keywords: BMI; body odors; chemosensory communication; chemosensory cues; diet; event-related potentials; fasting; metabolic state; olfaction; satiety.
Conflict of interest statement
The authors declare no conflict of interest.
Figures
Similar articles
-
Chemosensory communication of aggression: women's fine-tuned neural processing of male aggression signals.Philos Trans R Soc Lond B Biol Sci. 2020 Jun 8;375(1800):20190270. doi: 10.1098/rstb.2019.0270. Epub 2020 Apr 20. Philos Trans R Soc Lond B Biol Sci. 2020. PMID: 32306885 Free PMC article.
-
Comparison of chemosensory, auditory and visual event-related potential amplitudes.Scand J Psychol. 2008 Jun;49(3):231-7. doi: 10.1111/j.1467-9450.2008.00647.x. Scand J Psychol. 2008. PMID: 18419588
-
Chemosensory event-related brain potentials (CSERP) after strictly monorhinal stimulation.Int J Psychophysiol. 2014 Sep;93(3):305-10. doi: 10.1016/j.ijpsycho.2014.06.009. Epub 2014 Jun 19. Int J Psychophysiol. 2014. PMID: 24952214
-
Assessment of chemosensory function using electroencephalographic techniques.Rhinology. 2012 Mar;50(1):13-21. doi: 10.4193/Rhino11.126. Rhinology. 2012. PMID: 22469600 Review.
-
Assessment of olfactory and trigeminal function using chemosensory event-related potentials.Neurophysiol Clin. 2006 Mar-Apr;36(2):53-62. doi: 10.1016/j.neucli.2006.03.005. Epub 2006 Apr 19. Neurophysiol Clin. 2006. PMID: 16844543 Review.
References
-
- Schwambergova D., Sorokowska A., Slamova Z., Fialova J.T., Sabiniewicz A., Nowak-Kornicka J., Borkowska B., Pawlowski B., Havlicek J. No evidence for association between human body odor quality and immune system functioning. Psychoneuroendocrinology. 2021;132:105363. doi: 10.1016/j.psyneuen.2021.105363. - DOI - PubMed
LinkOut - more resources
Full Text Sources
