. 2021 Sep 11;12(9):1402.
doi: 10.3390/genes12091402.

Wild-Type KRAS Allele Effects on Druggable Targets in KRAS Mutant Lung Adenocarcinomas

Affiliations

Wild-Type KRAS Allele Effects on Druggable Targets in KRAS Mutant Lung Adenocarcinomas

Elisa Baldelli et al. Genes (Basel). .

Abstract

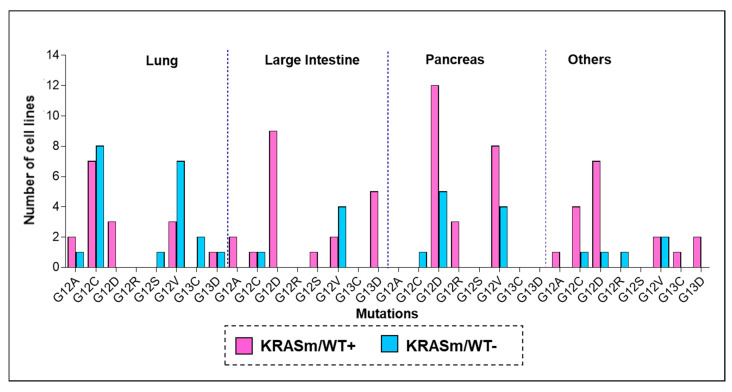
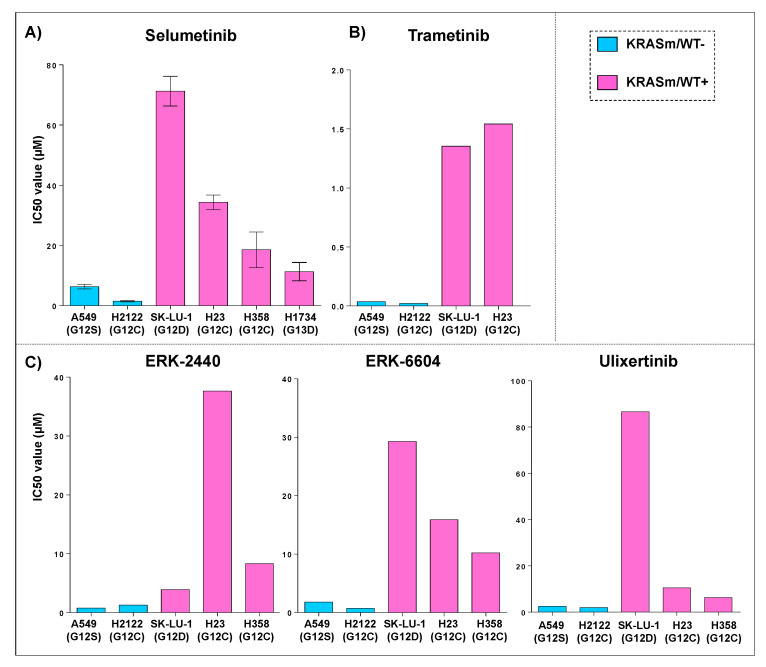
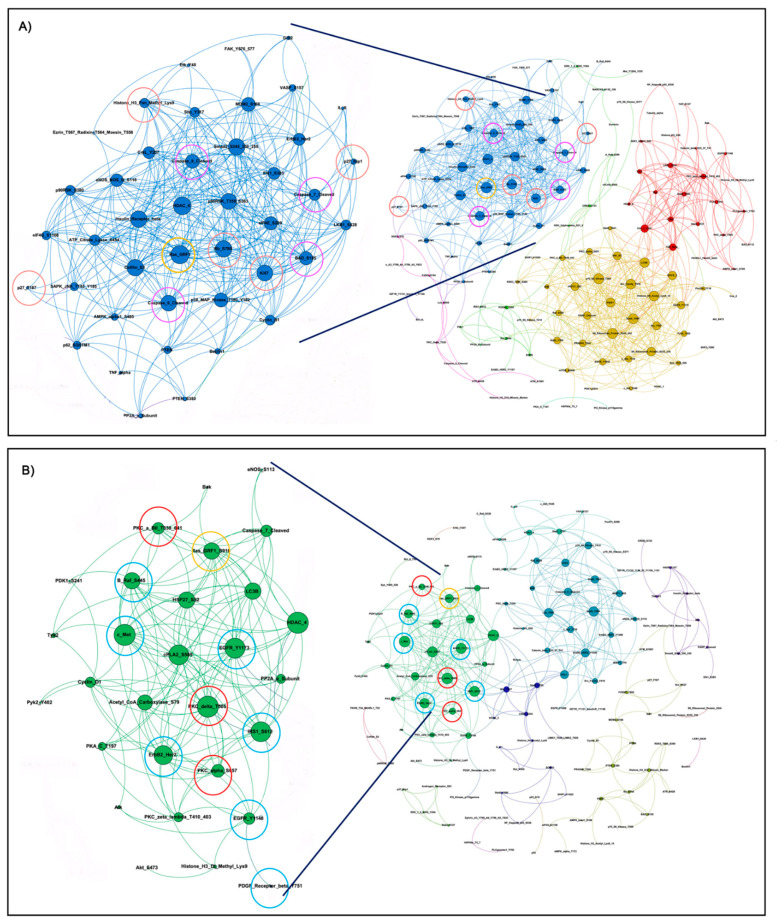
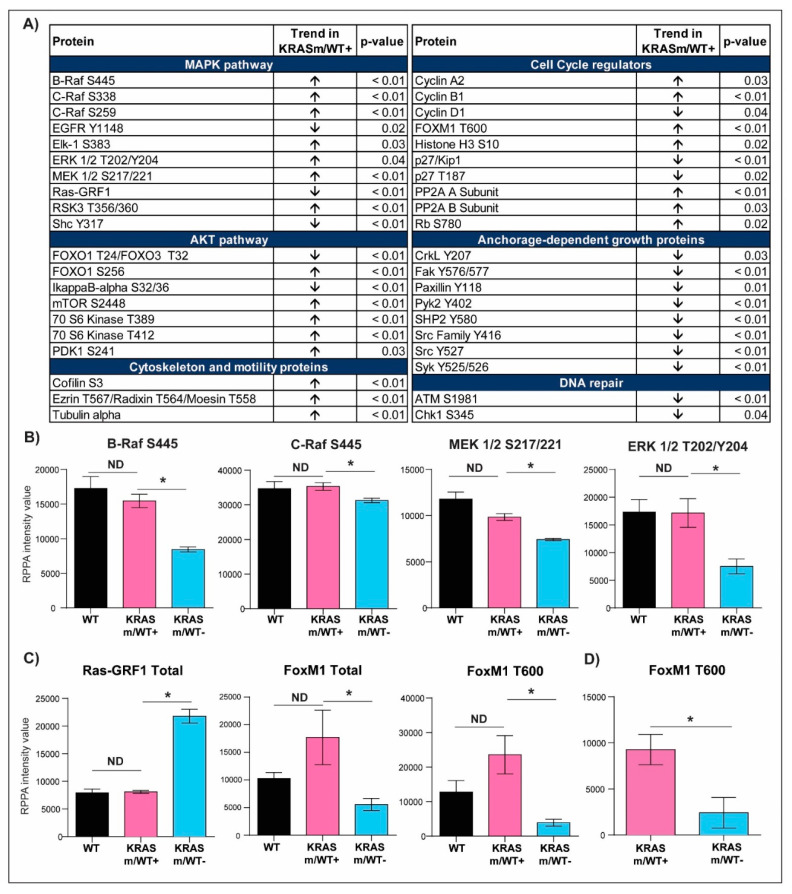
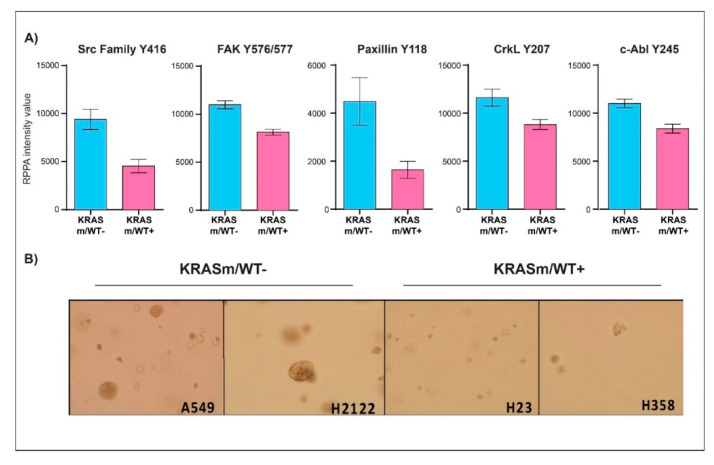
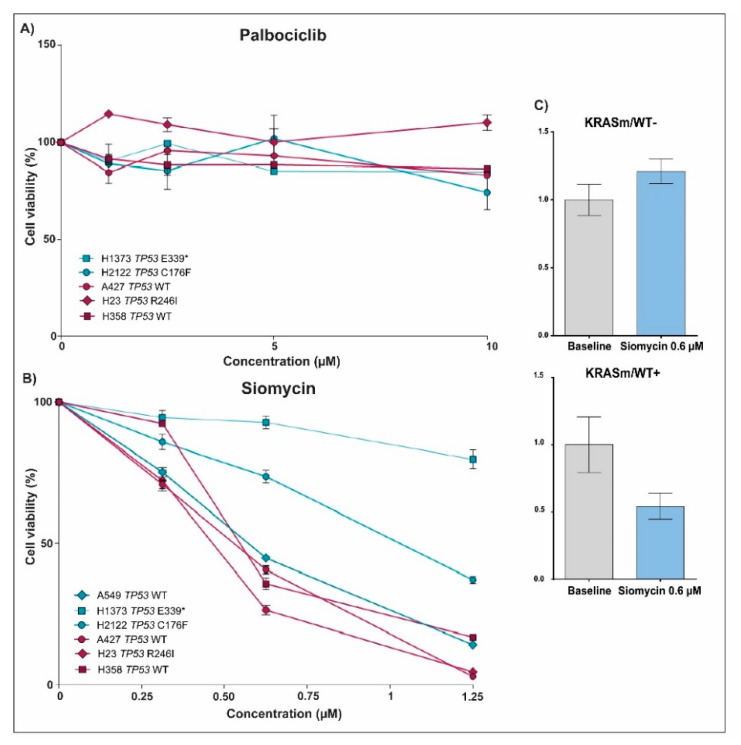
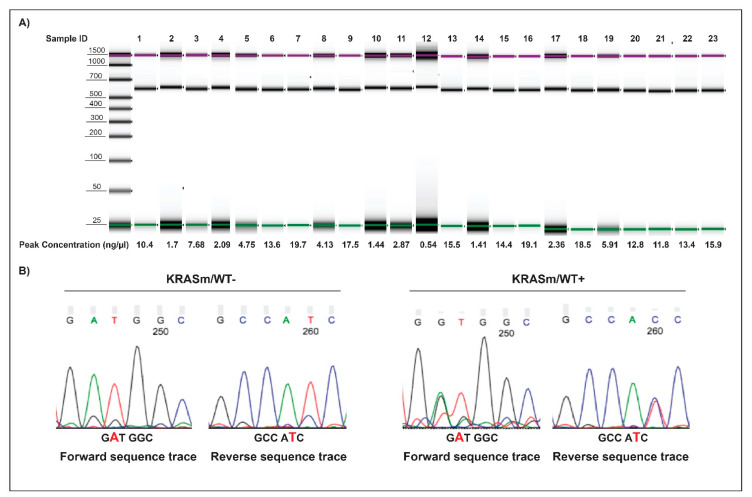
KRAS mutations are one of the most common oncogenic drivers in non-small cell lung cancer (NSCLC) and in lung adenocarcinomas in particular. Development of therapeutics targeting KRAS has been incredibly challenging, prompting indirect inhibition of downstream targets such as MEK and ERK. Such inhibitors, unfortunately, come with limited clinical efficacy, and therefore the demand for developing novel therapeutic strategies remains an urgent need for these patients. Exploring the influence of wild-type (WT) KRAS on druggable targets can uncover new vulnerabilities for the treatment of KRAS mutant lung adenocarcinomas. Using commercially available KRAS mutant lung adenocarcinoma cell lines, we explored the influence of WT KRAS on signaling networks and druggable targets. Expression and/or activation of 183 signaling proteins, most of which are targets of FDA-approved drugs, were captured by reverse-phase protein microarray (RPPA). Selected findings were validated on a cohort of 23 surgical biospecimens using the RPPA. Kinase-driven signatures associated with the presence of the KRAS WT allele were detected along the MAPK and AKT/mTOR signaling pathway and alterations of cell cycle regulators. FoxM1 emerged as a potential vulnerability of tumors retaining the KRAS WT allele both in cell lines and in the clinical samples. Our findings suggest that loss of WT KRAS impacts on signaling events and druggable targets in KRAS mutant lung adenocarcinomas.

Keywords: KRAS; drug target; non-small cell lung cancer; reverse-phase protein microarray; zygosity.


Conflict of interest statement

The authors are inventors on US Government and University assigned patents and patent applications that cover aspects of the technologies discussed such as the reverse-phase protein microarrays. As inventors, they are entitled to receive royalties as provided by US Law and George Mason University policy. M.P and E.F.P receive royalties from Theralink Technologies, Inc. E.F.P is a shareholder and consultant of Theralink Technologies and Perthera, Inc.; M.P is a consultant of Theralink Technologies, Inc.

Figures

Figure 1
Figure 1
Frequency of KRAS oncogenic mutations across cancer cells lines of different origin. To explore frequency and distribution of KRASm/WT+ and KRASm/WT− mutations across tumor types, KRAS zygosity was retrieved from the COSMIC and the NCI-funded KRAS initiative databases. Mutant KRAS cell lines were classified based on the presence (KRASm/WT+ pink) or absence (KRASm/WT− blue) of the KRAS WT allele. Frequencies of KRASm/WT+ and KRASm/WT− cell lines are displayed as bar graphs; mutations are listed on the x-axis, and number of cell lines identified for each variant is reported on the y-axis. Of the 116 identified cell lines, 38 were derived from lung lesions (32.7%), 33 from pancreatic cancers (28.4%), and 25 from tumors of the large intestine (21.5%). The 36 lung cancer models included in the analysis were established from the following tumors: 22 adenocarcinomas, 4 large cell carcinomas, 2 small cell lung cancers, 2 carcinomas not otherwise specified, 2 giant cell carcinoma, 1 adeno-squamous, 1 squamous carcinoma, 1 carcinoid and 1 epidermoid tumor.
Figure 2
Figure 2
Sensitivity to MEK and ERK inhibitors in KRASm/WT− and KRASm/WT+ adenocarcinoma cell lines. IC50 values for KRAS mutant cell lines treated with a kinase inhibitor targeting KRAS downstream substrates are displayed as bar graphs where cell lines are color-coded based on the presence (KRASm/WT+ pink) or absence (KRASm/WT− blue) of the KRAS WT allele. IC50 average values (n = 4) and standard error of the mean after incubation with the MEK inhibitor Selumetinib for 72 h are displayed (A); models harboring KRASm/WT− mutations are more sensitive to MEK inhibition compared to cell lines retaining the wild-type copy of the KRAS allele (A). These trends were confirmed using data retrieved from the Genomics of Drug Sensitivity in Cancer (GDSC) database for the MEK inhibitor Trametinib (B) and the ERK inhibitors Ulixertinib, ERK6604 and ERK2440 (C). Single IC50 values are available for each compound on the GDSC database.
Figure 3
Figure 3
Interaction networks of signal transduction molecules in KRASm/WT− and KRASm/WT+ NSCLC models. Spearman rank-order correlation coefficients of RPPA-based continuous values greater than 0.90 across the 183 measured analytes are displayed using network maps. Protein networks of KRASm/WT− (A549, H2122) show high levels of interaction with most proteins contained within three main clusters (A). Cell cycle regulators and proteins belonging to the apoptotic pathway are highlighted with red and pink circles, respectively. Network of KRASm/WT+ cell lines (H1734, H23, H358) shows fewer interconnections compared to the KRASm/WT− cells (B). Receptor tyrosine kinase, MAPK signaling molecules and members of the PKC family are highlighted in red and green, respectively. Ras-GFR-1 is highlighted in yellow in both maps.
Figure 4
Figure 4
Selected signal transduction molecules differentially activated in KRASm/WT+ and KRASm/WT− NSCLC models. Of the 183 signaling molecules measured by RPPA, 81 reached statistical significance when KRASm/WT− and KRASm/WT+ cell lines were compared. Proteins belonging to the same signaling pathway were grouped based on their biological function and are displayed in (A). Arrows reflect trends in the KRASm/WT+ cells (H1734, H23, H358) compared to KRASm/WT− (A549, H2122) models. Bar graphs displaying mean and standard error of the mean for member of the MAPK pathway are shown in (B). Of interest, while the activation of KRAS downstream signaling substrates reached statistical significance when KRASm/WT− and KRASm/WT+ cell lines were compared (*), these differences were lost between KRASm/WT+ and KRAS wild-type models (ND). Similar trends were also detected for Ras-GRF1, a modulator of RAS activity, and the cell cycle regulator FoxM1 (C). Differences in the activation of the cell cycle regulator FoxM1 between KRASm/WT− and KRASm/WT+ tumors were confirmed in surgical specimens, suggesting clinical relevance for this finding (D). * Indicates comparisons that were statistically different (p < 0.05).
Figure 5
Figure 5
Anchorage-independent growth is enhanced in KRASm/WT− NSCLC cell lines. Bar graphs display mean and standard error of the mean of expression and activation of key signaling molecules involved in anchorage-independent growth in KRASm/WT− (A549, H2122) and KRASm/WT+ (H1734, H23, H358) (A). Colony formation assay shows larger and more abundant colonies in the KRASm/WT− cell lines compared to KRASm/WT+ models (B), confirming increased anchorage-independent growth in the KRASm/WT lines.
Figure 6
Figure 6
Drug sensitivity assay and changes in FoxM1 expression after treatment with Palbociclib and Siomycin in KRASm/WT+ and KRASm/WT− NSCLC cell lines. Line plots show cell viability after 72 hours of incubation with Palbociclib and Siomycin in KRASm/WT− (A549, H1373 and H2122; blue lines) and KRASm/WT+ (A427, H23 and H358; red lines) cell lines (A,B). Data were normalized on matched vehicle control samples, namely PBS and DMSO for Palbociclib and Siomycin, respectively. Changes in FoxM1 phosphorylation levels after 72 hours of incubation with 0.6 µM of Siomycin were captured in KRASm/WT+ and KRASm/WT− lines using the RPPA (C). * Indicates stop codon.
Figure 7
Figure 7
Amplicons and electropherogram of 23 microdissected NSCLC surgical specimens. Amplicons along with DNA concentration of the 23 microdissected biospecimens analyzed by PCR are displayed in (A). Examples of sequencing electropherograms with forward and reverse sequence of KRASm/WT+ and KRASm/WT− samples harboring a KRAS G12D mutation are shown in (B). Samples were classified as KRASm/WT− when a single peak was detected at the mutation site.

References

    1. Haigis K.M. KRAS Alleles: The Devil Is in the Detail. Trends Cancer. 2017;3:686–697. doi: 10.1016/j.trecan.2017.08.006. - DOI - PMC - PubMed
    1. Jančík S., Drábek J., Radzioch D., Hajdúch M. Clinical Relevance of KRAS in Human Cancers. J. Biomed. Biotechnol. 2010;2010:1–13. doi: 10.1155/2010/150960. - DOI - PMC - PubMed
    1. Liu P., Wang Y., Li X. Targeting the Untargetable KRAS in Cancer Therapy. Acta Pharm. Sin. B. 2019;9:871–879. doi: 10.1016/j.apsb.2019.03.002. - DOI - PMC - PubMed
    1. Prior I.A., Lewis P.D., Mattos C. A Comprehensive Survey of Ras Mutations in Cancer. Cancer Res. 2012;72:2457–2467. doi: 10.1158/0008-5472.CAN-11-2612. - DOI - PMC - PubMed
    1. Ayati A., Moghimi S., Salarinejad S., Safavi M., Pouramiri B., Foroumadi A. A review on progression of epidermal growth factor receptor (EGFR) inhibitors as an efficient approach in cancer targeted therapy. Bioorg. Chem. 2020;99:103811. doi: 10.1016/j.bioorg.2020.103811. - DOI - PubMed

Publication types

MeSH terms

Substances