Descending Dysploidy and Bidirectional Changes in Genome Size Accompanied Crepis (Asteraceae) Evolution
- PMID: 34573417
- PMCID: PMC8472258
- DOI: 10.3390/genes12091436
Descending Dysploidy and Bidirectional Changes in Genome Size Accompanied Crepis (Asteraceae) Evolution
Abstract
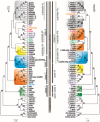
The evolution of the karyotype and genome size was examined in species of Crepis sensu lato. The phylogenetic relationships, inferred from the plastid and nrITS DNA sequences, were used as a framework to infer the patterns of karyotype evolution. Five different base chromosome numbers (x = 3, 4, 5, 6, and 11) were observed. A phylogenetic analysis of the evolution of the chromosome numbers allowed the inference of x = 6 as the ancestral state and the descending dysploidy as the major direction of the chromosome base number evolution. The derived base chromosome numbers (x = 5, 4, and 3) were found to have originated independently and recurrently in the different lineages of the genus. A few independent events of increases in karyotype asymmetry were inferred to have accompanied the karyotype evolution in Crepis. The genome sizes of 33 Crepis species differed seven-fold and the ancestral genome size was reconstructed to be 1C = 3.44 pg. Both decreases and increases in the genome size were inferred to have occurred within and between the lineages. The data suggest that, in addition to dysploidy, the amplification/elimination of various repetitive DNAs was likely involved in the genome and taxa differentiation in the genus.
Keywords: chromosome number; flow cytometry; genome size; karyotype formula; phylogenetic analysis.
Conflict of interest statement
The authors declare no conflict of interest.
Figures


Similar articles
-
Molecular and Cytogenetic Analysis of rDNA Evolution in Crepis Sensu Lato.Int J Mol Sci. 2022 Mar 26;23(7):3643. doi: 10.3390/ijms23073643. Int J Mol Sci. 2022. PMID: 35409003 Free PMC article.
-
Genome size shifts: karyotype evolution in Crepis section Neglectoides (Asteraceae).Plant Biol (Stuttg). 2015 Jul;17(4):775-86. doi: 10.1111/plb.12318. Epub 2015 Apr 9. Plant Biol (Stuttg). 2015. PMID: 25683604
-
A deep dive into the ancestral chromosome number and genome size of flowering plants.New Phytol. 2020 Nov;228(3):1097-1106. doi: 10.1111/nph.16668. Epub 2020 Jun 16. New Phytol. 2020. PMID: 32421860
-
Evolution of genome size and chromosome number in the carnivorous plant genus Genlisea (Lentibulariaceae), with a new estimate of the minimum genome size in angiosperms.Ann Bot. 2014 Dec;114(8):1651-63. doi: 10.1093/aob/mcu189. Epub 2014 Oct 1. Ann Bot. 2014. PMID: 25274549 Free PMC article.
-
Progressive refinement of the karyotyping of Brachypodium genomes.New Phytol. 2020 Sep;227(6):1668-1675. doi: 10.1111/nph.16342. Epub 2020 Jan 3. New Phytol. 2020. PMID: 31774178 Review.
Cited by
-
Tracing the Evolution of the Angiosperm Genome from the Cytogenetic Point of View.Plants (Basel). 2022 Mar 16;11(6):784. doi: 10.3390/plants11060784. Plants (Basel). 2022. PMID: 35336666 Free PMC article. Review.
-
The Chromosome Number and rDNA Loci Evolution in Onobrychis (Fabaceae).Int J Mol Sci. 2022 Sep 20;23(19):11033. doi: 10.3390/ijms231911033. Int J Mol Sci. 2022. PMID: 36232345 Free PMC article.
-
Allium cytogenetics: a critical review on the Indian taxa.Comp Cytogenet. 2023 May 29;17:129-156. doi: 10.3897/CompCytogen.17.98903. eCollection 2023. Comp Cytogenet. 2023. PMID: 37304149 Free PMC article. Review.
-
Generic concepts and species diversity within the Gynoxyoid clade (Senecioneae, Compositae).PhytoKeys. 2023 Oct 10;234:61-106. doi: 10.3897/phytokeys.234.107750. eCollection 2023. PhytoKeys. 2023. PMID: 37860599 Free PMC article.
-
Molecular and Cytogenetic Analysis of rDNA Evolution in Crepis Sensu Lato.Int J Mol Sci. 2022 Mar 26;23(7):3643. doi: 10.3390/ijms23073643. Int J Mol Sci. 2022. PMID: 35409003 Free PMC article.
References
-
- Lysák M.A., Schubert I. Mechanisms of Chromosome Rearrangements. In: Greilhuber J., Dolezel J., Wendel J.F., editors. Plant Genome Diversity Volume 2: Physical Structure, Behaviour and Evolution of Plant Genomes. Springer Vienna; Vienna, Austria: 2013. pp. 137–147. - DOI
Publication types
MeSH terms
LinkOut - more resources
Full Text Sources

