

Over-Expression of the Cell-Cycle Gene LaCDKB1;2 Promotes Cell Proliferation and the Formation of Normal Cotyledonary Embryos during Larix kaempferi Somatic Embryogenesis
- PMID: 34573419
- PMCID: PMC8468589
- DOI: 10.3390/genes12091435
Over-Expression of the Cell-Cycle Gene LaCDKB1;2 Promotes Cell Proliferation and the Formation of Normal Cotyledonary Embryos during Larix kaempferi Somatic Embryogenesis
Abstract
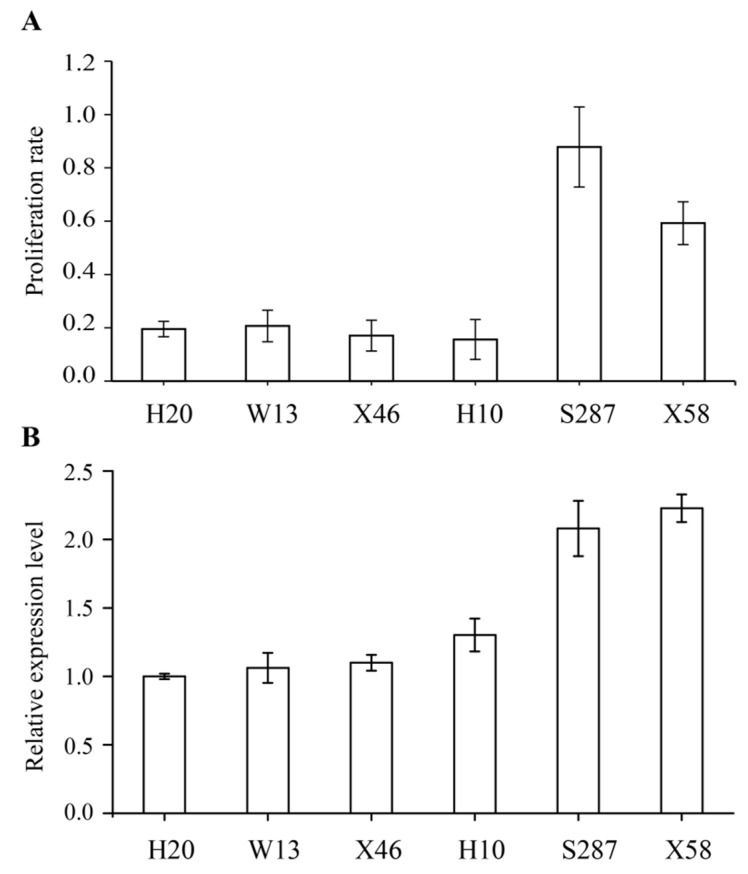
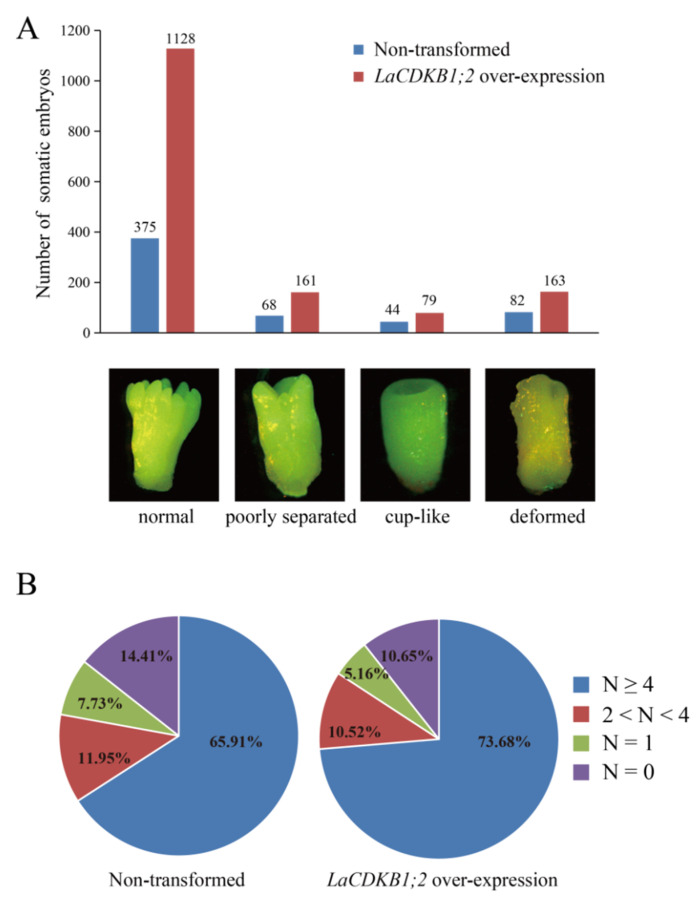
Somatic embryogenesis is an effective tool for the production of forest tree seedlings with desirable characteristics; however, the low initiation frequency and productivity of high-quality mature somatic embryos are still limiting factors for Larix kaempferi (Japanese larch). Here, we analyzed the expression pattern of L. kaempferi cyclin-dependent kinase B 1;2 (LaCDKB1;2) during somatic embryogenesis in L. kaempferi and its relationship with the cell proliferation rate. We also analyzed the effect of LaCDKB1;2 over-expression on somatic embryo quality. The results revealed a positive correlation between LaCDKB1;2 expression and the cell proliferation rate during the proliferation stage. After LaCDKB1;2 over-expression, the proliferation rate of cultures increased, and the number of somatic embryos in transgenic cultures was 2.69 times that in non-transformed cultures. Notably, the number of normal cotyledonary embryos in transgenic cultures was 3 times that in non-transformed cultures, indicating that LaCDKB1;2 not only increases the proliferation of cultures and the number of somatic embryos but also improves the quality of somatic embryos. These results provide insight into the regulatory mechanisms of somatic embryogenesis as well as new Larix breeding material.
Keywords: 2; LaCDKB1; Larix kaempferi; cell-cycle gene; somatic embryogenesis.
Conflict of interest statement
The authors declare no conflict of interest.
Figures


Similar articles
-
H2O2 Significantly Affects Larix kaempferi × Larix olgensis Somatic Embryogenesis.Int J Mol Sci. 2024 Jan 4;25(1):669. doi: 10.3390/ijms25010669. Int J Mol Sci. 2024. PMID: 38203839 Free PMC article.
-
cDNA cloning, genomic organization and expression analysis during somatic embryogenesis of the translationally controlled tumor protein (TCTP) gene from Japanese larch (Larix leptolepis).Gene. 2013 Oct 15;529(1):150-8. doi: 10.1016/j.gene.2013.07.076. Epub 2013 Aug 9. Gene. 2013. PMID: 23933269
-
Embryogenic callus induction from immature zygotic embryos and genetic transformation of Larix kaempferi 3x Larix gmelinii 9.PLoS One. 2021 Oct 14;16(10):e0258654. doi: 10.1371/journal.pone.0258654. eCollection 2021. PLoS One. 2021. PMID: 34648587 Free PMC article.
-
Dying with Style: Death Decision in Plant Embryogenesis.Methods Mol Biol. 2016;1359:101-15. doi: 10.1007/978-1-4939-3061-6_5. Methods Mol Biol. 2016. PMID: 26619860 Review.
-
The role of miRNA in somatic embryogenesis.Genomics. 2019 Sep;111(5):1026-1033. doi: 10.1016/j.ygeno.2018.11.022. Epub 2018 Nov 23. Genomics. 2019. PMID: 30476555 Review.
Cited by
-
Identification of Target Gene and Interacting Protein of Two LaSCL6 Alternative Splicing Variants Provides Novel Insights into Larch Somatic Embryogenesis.Plants (Basel). 2024 Oct 31;13(21):3072. doi: 10.3390/plants13213072. Plants (Basel). 2024. PMID: 39519988 Free PMC article.
-
Screening and Functional Evaluation of Four Larix kaempferi Promoters.Plants (Basel). 2024 Oct 3;13(19):2777. doi: 10.3390/plants13192777. Plants (Basel). 2024. PMID: 39409647 Free PMC article.
-
LkARF7 and LkARF19 overexpression promote adventitious root formation in a heterologous poplar model by positively regulating LkBBM1.Commun Biol. 2023 Apr 5;6(1):372. doi: 10.1038/s42003-023-04731-3. Commun Biol. 2023. PMID: 37020138 Free PMC article.
-
Integrated transcriptomic and metabolic analyses provide insights into the maintenance of embryogenic potential and the biosynthesis of phenolic acids and flavonoids involving transcription factors in Larix kaempferi (Lamb.) Carr.Front Plant Sci. 2022 Nov 17;13:1056930. doi: 10.3389/fpls.2022.1056930. eCollection 2022. Front Plant Sci. 2022. PMID: 36466286 Free PMC article.
-
VS-Cambium-Developer: A New Predictive Model of Cambium Functioning under the Influence of Environmental Factors.Plants (Basel). 2023 Oct 17;12(20):3594. doi: 10.3390/plants12203594. Plants (Basel). 2023. PMID: 37896057 Free PMC article.
References
-
- Hakman I., Fowke L.C., Von Arnold S., Eriksson T. The development of somatic embryos in tissue cultures initiated from immature embryos of Picea abies (Norway Spruce) Plant Sci. 1985;38:53–59. doi: 10.1016/0168-9452(85)90079-2. - DOI
-
- Kim Y.W., Youn Y., Noh E.R., Kim J.C. Somatic embryogenesis and plant regeneration from immature zygotic embryos of Japanese larch (Larix leptolepis) Plant Cell Tissue Organ Cult. 1998;55:95–101. doi: 10.1023/A:1006120302512. - DOI
-
- Alonso P., Moncaleán P., Fernández B., Rodríguez A., Centeno M.L., Ordás R.J. An improved micropropagation protocol for stone pine (Pinus pinea L.) Ann. For. Sci. 2006;63:879–885. doi: 10.1051/forest:2006071. - DOI
-
- Carneros E., Celestino C., Klimaszewska K., Park Y.S., Toribio M., Bonga J.M. Plant regeneration in Stone pine (Pinus pinea L.) by somatic embryogenesis. Plant Cell Tissue Organ Cult. 2009;98:165–178. doi: 10.1007/s11240-009-9549-3. - DOI
-
- Castander-Olarrieta A., Moncaleán P., Montalbán I.A. Pinus canariensis plant regeneration through somatic embryogenesis. For. Syst. 2020;29:eSC05. doi: 10.5424/fs/2020291-16136. - DOI
Publication types
MeSH terms
Substances
LinkOut - more resources
Full Text Sources
