Optical Coherence Tomography Angiography in Type 1 Diabetes Mellitus. Report 4: Glycated Haemoglobin
- PMID: 34573883
- PMCID: PMC8472643
- DOI: 10.3390/diagnostics11091537
Optical Coherence Tomography Angiography in Type 1 Diabetes Mellitus. Report 4: Glycated Haemoglobin
Abstract
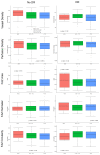
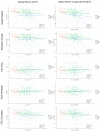
The purpose of this study was to evaluate specifically the relationship between glycated haemoglobin (HbA1c) levels and retinal optical coherence tomography (OCT) and OCT angiography (OCTA) parameters in type 1 Diabetes Mellitus (DM). A total of 478 type 1 DM patients and 115 controls were included in a prospective OCTA trial (ClinicalTrials.gov NCT03422965). Subgroup analysis was performed for controls, no diabetic retinopathy (DM-no DR) and DR patients (DM-DR), and HbA1c levels. OCT and OCTA measurements were compared with HbA1c levels (current and previous 5 years). DM-no DR patients with HbA1c levels >7.5% showed lower VD than DM-DR and controls (20.16 vs. 20.22 vs. 20.71, p < 0.05), and showed a significant correlation between HbA1c levels and FAZc (p = 0.04), after adjusting for age, gender, signal strength index, axial length, and DM disease duration. DM-DR patients with HbA1c > 7.5% presented greater CRT than DM-no DR and controls (270.8 vs. 260 vs. 251.1, p < 0.05) and showed a significant correlation between HbA1c and CRT (p = 0.03). In conclusion, greater levels of HbA1c are associated with OCTA changes in DM-no DR patients, and with structural OCT changes in DM-DR patients. The combination of OCTA and OCT measurements and HbA1c levels may be helpful to identify patients at risk of progression to greater stages of the diabetic microvascular disease.
Keywords: HbA1c; diabetic retinopathy; foveal avascular zone; glycated haemoglobin; macular thickness; oculomics; optical coherence tomography; optical coherence tomography angiography; perfusion density; vessel density.
Conflict of interest statement
J.Z.-V. and A.A. are speakers for Topcon and Zeiss. None of the authors have any financial interest in the devices employed in this study. The authors declare no conflict of interest.
Figures


Similar articles
-
Optical Coherence Tomography Angiography in Type 1 Diabetes Mellitus. Report 1: Diabetic Retinopathy.Transl Vis Sci Technol. 2020 Sep 30;9(10):34. doi: 10.1167/tvst.9.10.34. eCollection 2020 Sep. Transl Vis Sci Technol. 2020. PMID: 33062397 Free PMC article.
-
Evaluation of microvascular changes in the perifoveal vascular network using optical coherence tomography angiography (OCTA) in type I diabetes mellitus: a large scale prospective trial.BMC Med Imaging. 2019 Nov 21;19(1):91. doi: 10.1186/s12880-019-0391-8. BMC Med Imaging. 2019. PMID: 31752726 Free PMC article. Clinical Trial.
-
Vessel Density around Foveal Avascular Zone as a Potential Imaging Biomarker for Detecting Preclinical Diabetic Retinopathy: An Optical Coherence Tomography Angiography Study.Semin Ophthalmol. 2020 Aug 17;35(5-6):316-323. doi: 10.1080/08820538.2020.1845386. Epub 2020 Dec 1. Semin Ophthalmol. 2020. PMID: 33258720
-
Optical Coherence Tomography Angiography in Diabetic Patients: A Systematic Review.Biomedicines. 2021 Dec 31;10(1):88. doi: 10.3390/biomedicines10010088. Biomedicines. 2021. PMID: 35052768 Free PMC article. Review.
-
Evaluation of Posterior Ocular Blood Flow in Diabetic Retinopathy Patients Without Macular Edema Using Optical Coherence Tomography Angiography.Photodiagnosis Photodyn Ther. 2023 Dec;44:103777. doi: 10.1016/j.pdpdt.2023.103777. Epub 2023 Sep 3. Photodiagnosis Photodyn Ther. 2023. PMID: 37669724 Review.
Cited by
-
Radiomics-Based Assessment of OCT Angiography Images for Diabetic Retinopathy Diagnosis.Ophthalmol Sci. 2022 Nov 21;3(2):100259. doi: 10.1016/j.xops.2022.100259. eCollection 2023 Jun. Ophthalmol Sci. 2022. PMID: 36578904 Free PMC article.
-
Oculomics: A Crusade Against the Four Horsemen of Chronic Disease.Ophthalmol Ther. 2024 Jun;13(6):1427-1451. doi: 10.1007/s40123-024-00942-x. Epub 2024 Apr 17. Ophthalmol Ther. 2024. PMID: 38630354 Free PMC article. Review.
-
Localization of Microvascular Changes in Systemic Disease Without Retinopathy Using Optical Coherence Tomography Angiography (OCTA).J Clin Med. 2025 Jan 9;14(2):372. doi: 10.3390/jcm14020372. J Clin Med. 2025. PMID: 39860380 Free PMC article.
-
Optical Coherence Tomography and Optical Coherence Tomography Angiography in Pediatric Retinal Diseases.Diagnostics (Basel). 2023 Apr 18;13(8):1461. doi: 10.3390/diagnostics13081461. Diagnostics (Basel). 2023. PMID: 37189561 Free PMC article. Review.
-
Retinal Imaging-Based Oculomics: Artificial Intelligence as a Tool in the Diagnosis of Cardiovascular and Metabolic Diseases.Biomedicines. 2024 Sep 23;12(9):2150. doi: 10.3390/biomedicines12092150. Biomedicines. 2024. PMID: 39335664 Free PMC article. Review.
References
-
- Ko F., Muthy Z.A., Gallacher J., Sudlow C., Rees G., Yang Q., Keane P.A., Petzold A., Khaw P.T., Reisman C., et al. Association of Retinal Nerve Fiber Layer Thinning with Current and Future Cognitive Decline: A Study Using Optical Coherence Tomography. JAMA Neurol. 2018 doi: 10.1001/jamaneurol.2018.1578. - DOI - PMC - PubMed
-
- Mutlu U., Colijn J.M., Ikram M.A., Bonnemaijer P.W.M., Licher S., Wolters F.J., Tiemeier H., Koudstaal P.J., Klaver C.C.W., Ikram M.K. Association of Retinal Neurodegeneration on Optical Coherence Tomography with Dementia: A Population-Based Study. JAMA Neurol. 2018;75:1256–1263. doi: 10.1001/jamaneurol.2018.1563. - DOI - PMC - PubMed
Associated data
Grants and funding
LinkOut - more resources
Full Text Sources
Medical
Research Materials

