. 2021 Sep 9;18(18):9497.
doi: 10.3390/ijerph18189497.

ECG Ventricular Repolarization Dynamics during Exercise: Temporal Profile, Relation to Heart Rate Variability and Effects of Age and Physical Health

Affiliations

ECG Ventricular Repolarization Dynamics during Exercise: Temporal Profile, Relation to Heart Rate Variability and Effects of Age and Physical Health

Adrián Hernández-Vicente et al. Int J Environ Res Public Health. .

Abstract

Periodic repolarization dynamics (PRD) is a novel electrocardiographic marker of cardiac repolarization instability with powerful risk stratification capacity for total mortality and sudden cardiac death. Here, we use a time-frequency analysis approach to continuously quantify PRD at rest and during exercise, assess its dependence on heart rate variability (HRV) and characterize the effects of age (young adults/middle-aged adults/older adults), body mass index (non-overweight/overweight) and cardiorespiratory fitness level (fit/unfit). Sixty-six male volunteers performed an exercise test. RR and dT variabilities (RRV, dTV), as well as the fraction of dT variability unrelated to RR variability, were computed based on time-frequency representations. The instantaneous LF power of dT (PdTV), representing the same concept as PRD, and of its RRV-unrelated component (PdTVuRRV) were quantified. dT angle was found to mostly oscillate in the LF band. Overall, 50-70% of PdTV was linearly unrelated to RRV. The onset of exercise caused a sudden increase in PdTV and PdTVuRRV, which returned to pre-exercise levels during recovery. Clustering analysis identified a group of overweight and unfit individuals with significantly higher PdTV and PdTVuRRV values at rest than the rest of the population. Our findings shed new light on the temporal profile of PRD during exercise, its relationship to HRV and the differences in PRD between subjects according to phenotypic characteristics.

Keywords: cluster analysis; electrocardiography; exercise test; heart rate variability; periodic repolarization dynamics; sympathetic nervous system; time-frequency analysis; ventricular repolarization.


Conflict of interest statement

The authors declare no conflict of interest. The funders had no role in the design of the study; in the collection, analyses, or interpretation of data; in the writing of the manuscript, or in the decision to publish the results.

Figures
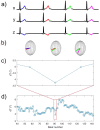
Figure 1
Figure 1
Computation of dT from an ECG in the Frank lead configuration. (a) T-waves from four consecutive heart beats. (b) Pairs of T-wave vectors from consecutive beats are illustrated in three-dimensional spheres. (c) Angle dT between the consecutive T-wave vectors shown in panel b. (d) Time series of dT for a piece of an ECG recording.
Figure 2
Figure 2
Example of the dT angle and RR interval time series for one subject throughout the entire test. Dotted lines separate the different test segments: resting (SREST), cycling (SCY) and recovery (SREC). SCY was divided into three stages corresponding to 60, 70 and 80% of estimated HRmax, denoted as SCY60, SCY70 and SCY80, respectively.
Figure 3
Figure 3
Example of the instantaneous power of LF oscillations for: RR variability (PRRV), dT variability (PdTV), dTV unrelated to RRV (PdTVuRRV) and dTV related to RRV (PdTVrRRV) obtained for the same subject as in Figure 2. Dotted lines separate the different test segments: resting (SREST), cycling (SCY) and recovery (SREC). SCY was divided into three stages corresponding to 60, 70 and 80% of estimated HRmax, denoted as SCY60, SCY70 and SCY80, respectively.
Figure 4
Figure 4
Example of the time-frequency distribution for RR variability (RRV), dT variability (dTV), dTV unrelated to RRV (PdTVuRRV) and dTV related to RRV (PdTVrRRV) obtained for the same subject as in Figure 2. Dotted lines separate the different test segments: resting (SREST), cycling (SCY) and recovery (SREC). SCY was divided into three stages corresponding to 60, 70 and 80% of estimated HRmax, denoted as SCY60, SCY70 and SCY80, respectively.
Figure 5
Figure 5
Box plots representing the distributions of PRRV, PdTV, PdTVuRRV and PdTVuRRVn (N = 66) over the study population (N = 66) for the different test segments: resting (SREST), cycling (SCY) and recovery (SREC). SCY was divided into three stages corresponding to 60, 70 and 80% of estimated HRmax, denoted as SCY60, SCY70 and SCY80. (a) LF oscillations of RR variability (PRRV), with the inset showing the three SCY stages. (b) LF oscillations of dT variability (PdTV). (c) PdTV unrelated to PRRV (PdTVuRRV). (d) Normalized PdTV unrelated to PRRV (PdTVuRRVn). * = Significant differences between test segments (p ≤ 0.05, Friedman’s ANOVA): * 1 = Different to SREST; * 2 = Different to SCY60; * 3 = Different to SCY70; * 4= Different to SCY80; * 5 = Different to SREC; ** = Different to all.
Figure 6
Figure 6
Examples of dTV, PdTV and PdTVuRRV at rest obtained for two subjects that are representative of each of the two clusters. A and B, described in the text.

References

    1. Haqqani H.M., Chan K.H., Kumar S., Denniss A.R., Gregory A.T. The Contemporary Era of Sudden Cardiac Death and Ventricular Arrhythmias: Basic Concepts, Recent Developments and Future Directions. Hear. Lung Circ. 2019;28:1–5. doi: 10.1016/S1443-9506(18)31972-3. - DOI - PubMed
    1. Emery M.S., Kovacs R.J. Sudden Cardiac Death in Athletes. JACC Hear. Fail. 2018;6:30–40. doi: 10.1016/j.jchf.2017.07.014. - DOI - PubMed
    1. John R.M., Tedrow U.B., Koplan B.A., Albert C.M., Epstein L.M., Sweeney M.O., Miller A.L., Michaud G.F., Stevenson W.G. Ventricular arrhythmias and sudden cardiac death. Lancet. 2012;380:1520–1529. doi: 10.1016/S0140-6736(12)61413-5. - DOI - PubMed
    1. Pueyo E., Smetana P., Caminal P., De Luna A.B., Malik M., Laguna P. Characterization of QT interval adaptation to RR interval changes and its use as a a risk-stratifier of arrhythmic mortality in amiodarone-treated survivors of acute myocardial infarction. IEEE Trans. Biomed. Eng. 2004;51:1511–1520. doi: 10.1109/TBME.2004.828050. - DOI - PubMed
    1. Ramírez J., Laguna P., Bayés De Luna A., Malik M., Pueyo E. QT/RR and T-peak-to-end/RR curvatures and slopes in chronic heart failure: Relation to sudden cardiac death. J. Electrocardiol. 2014;47:842–848. doi: 10.1016/j.jelectrocard.2014.08.013. - DOI - PubMed

Publication types