

Practical Impact of the COVID-19 Pandemic on Indoor Air Quality and Thermal Comfort in Kindergartens. A Case Study of Slovenia
- PMID: 34574634
- PMCID: PMC8472386
- DOI: 10.3390/ijerph18189712
Practical Impact of the COVID-19 Pandemic on Indoor Air Quality and Thermal Comfort in Kindergartens. A Case Study of Slovenia
Abstract
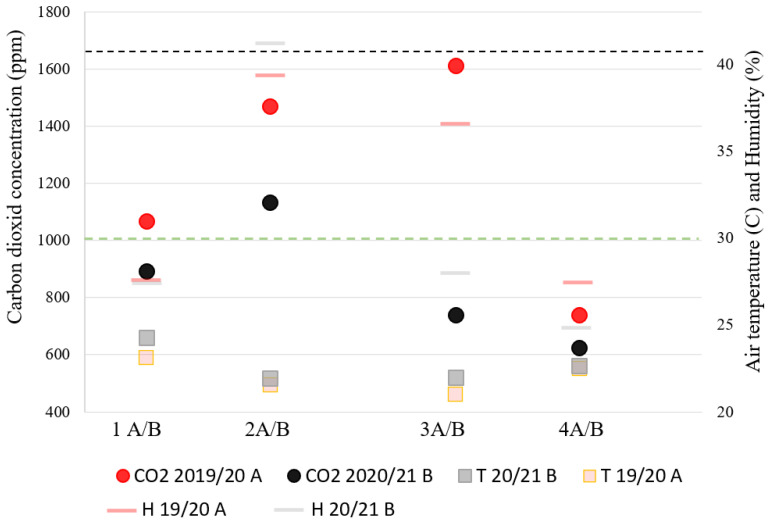
The experimental monitoring of carbon dioxide concentration was carried out in kindergartens in Slovenia, together with indoor air temperature and relative humidity, before and during the COVID-19 pandemic. The aim of the research was to estimate the practical impact of the pandemic on indoor air quality and thermal comfort. The case study sample included buildings with different architectural typology, which are predominantly present in the building stock of Slovenia. The monitoring process lasted for 125 days before and during the COVID-19 pandemic. The results have shown a better indoor air quality in kindergartens during the pandemic, mostly due to ventilation protocols and almost imperceptibly changed indoor air temperature. The COVID-19 pandemic affected air quality in kindergarten classrooms in Slovenia by reducing the average carbon dioxide concentration when children were present in classrooms by 30%.
Keywords: COVID-19; IAQ; kindergartens; thermal comfort.
Conflict of interest statement
The authors declare no conflict of interest.
Figures
References
-
- Karkour S., Itsubo N. Influence of the Covid-19 crisis on global PM2.5 concentration and related health impacts. Sustainability. 2020;12:5297. doi: 10.3390/su12135297. - DOI
-
- Debone D., da Costa M.V., Miraglia S.G.E.K. 90 days of COVID-19 social distancing and its impacts on air quality and health in Sao Paulo, Brazil. Sustainability. 2020;12:7440. doi: 10.3390/su12187440. - DOI
-
- Berman J.D., Ebisu K. Changes in U.S. air pollution during the COVID-19 pandemic. [(accessed on 8 September 2020)];Sci. Total. Environ. 2020 739:139864. doi: 10.1016/j.scitotenv.2020.139864. Available online: https://reader.elsevier.com/reader/sd/pii/S0048969720333842?token=AB96DC.... - DOI - PMC - PubMed
-
- Alonso A., Llanos J., Escandón R., Sendra J.J. Effects of the COVID-19 Pandemic on indoor air quality and thermal comfort of primary schools in winter in a Mediterraneanclimate. Sustainability. 2021;13:2699. doi: 10.3390/su13052699. - DOI
Publication types
MeSH terms
Substances
LinkOut - more resources
Full Text Sources
Medical
