. 2021 Aug 31;11(9):871.
doi: 10.3390/jpm11090871.

Nepenthes Extract Induces Selective Killing, Necrosis, and Apoptosis in Oral Cancer Cells

Affiliations

Nepenthes Extract Induces Selective Killing, Necrosis, and Apoptosis in Oral Cancer Cells

Kun-Han Yang et al. J Pers Med. .

Abstract

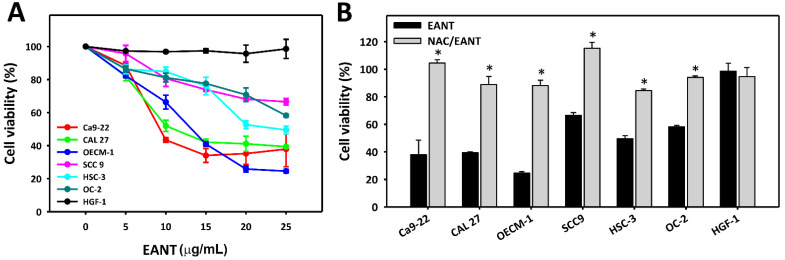
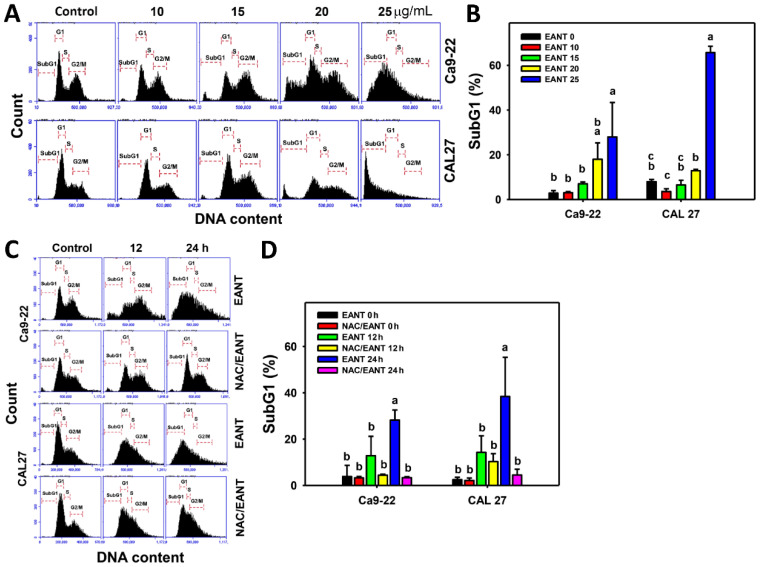
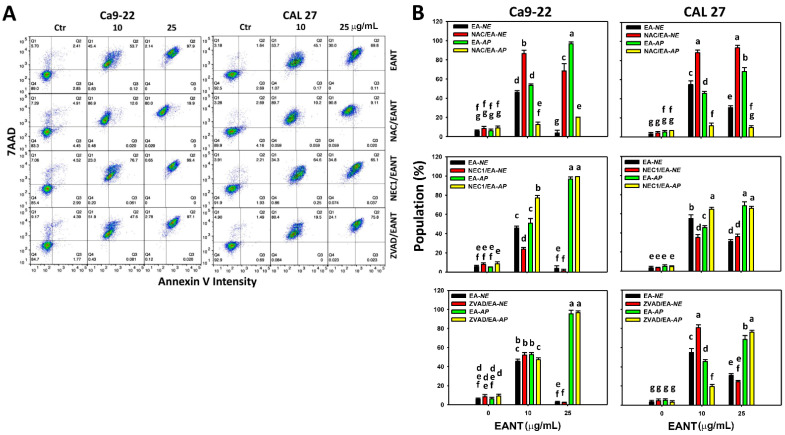
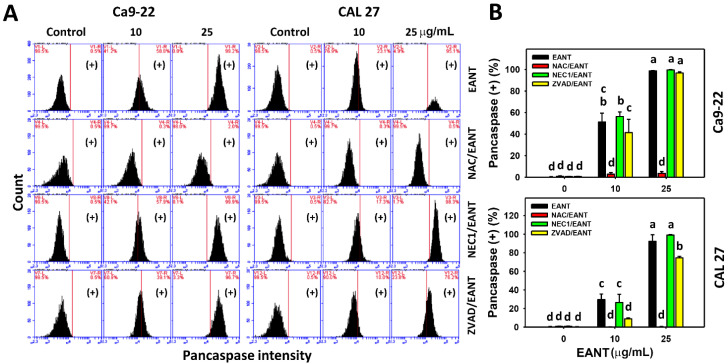
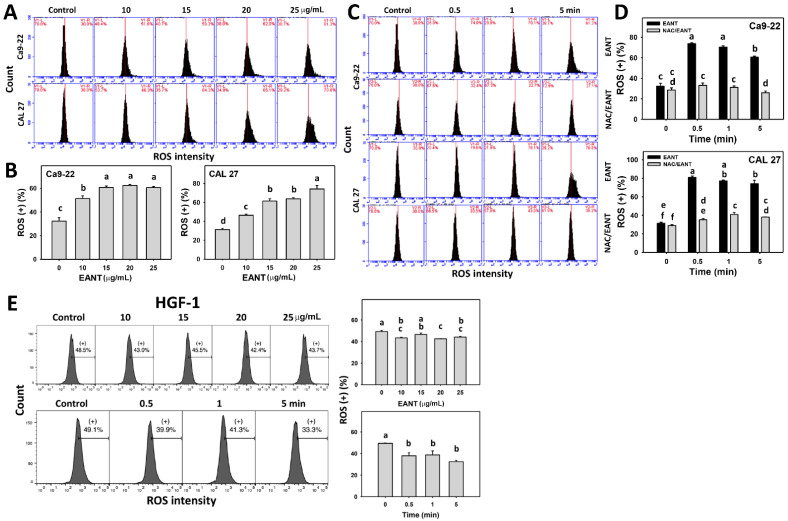
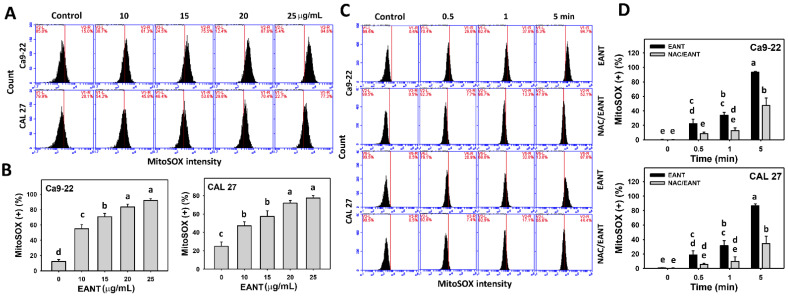
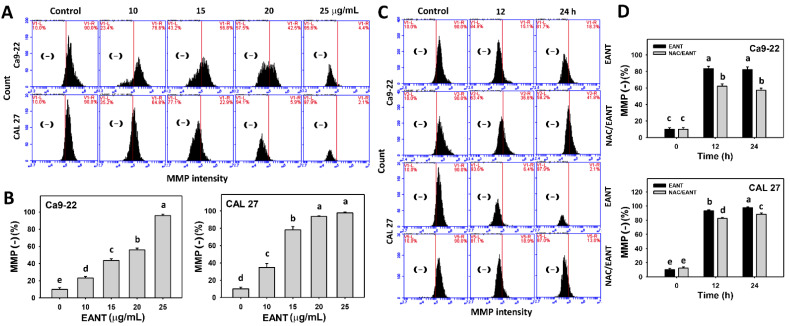
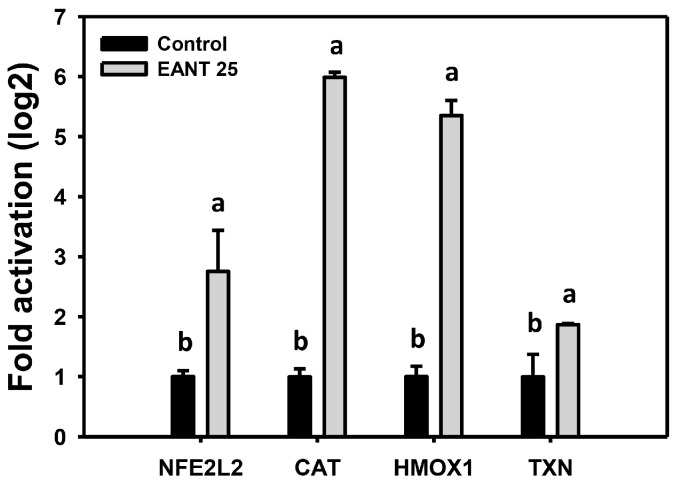
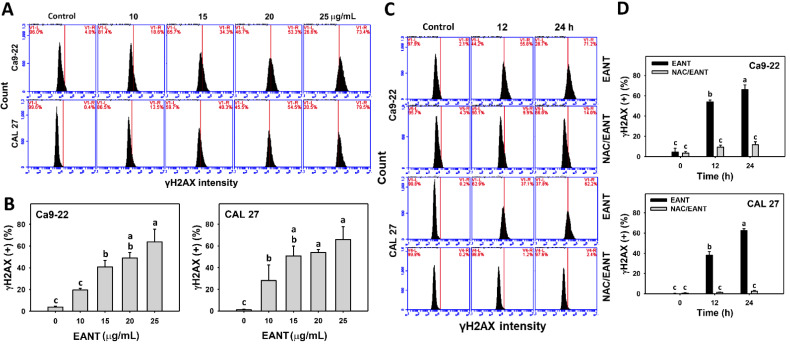
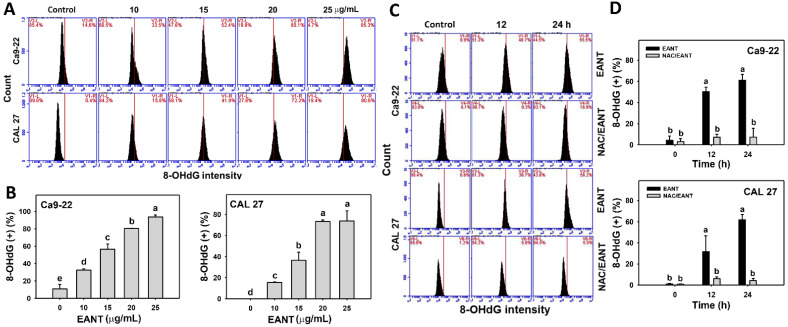
Ethyl acetate Nepenthes extract (EANT) from Nepenthes thorellii × (ventricosa × maxima) shows antiproliferation and apoptosis but not necrosis in breast cancer cells, but this has not been investigated in oral cancer cells. In the present study, EANT shows no cytotoxicity to normal oral cells but exhibits selective killing to six oral cancer cell lines. They were suppressed by pretreatment of the antioxidant inhibitor N-acetylcysteine (NAC), demonstrating that EANT-induced cell death was mediated by oxidative stress. Concerning high sensitivity to EANT, Ca9-22 and CAL 27 oral cancer cells were chosen for exploring detailed selective killing mechanisms. EANT triggers a mixture of necrosis and apoptosis as determined by annexin V/7-aminoactinmycin D analysis. Still, they show differential switches from necrosis at a low (10 μg/mL) concentration to apoptosis at high (25 μg/mL) concentration of EANT in oral cancer cells. NAC induces necrosis but suppresses annexin V-detected apoptosis in oral cancer cells. Necrostatin 1 (NEC1), a necroptosis inhibitor, moderately suppresses necrosis but induces apoptosis at 10 μg/mL EANT. In contrast, Z-VAD-FMK, a pancaspase inhibitor, slightly causes necrosis but suppresses apoptosis at 10 μg/mL EANT. Furthermore, the flow cytometry-detected pancaspase activity is dose-responsively increased but is suppressed by NAC and ZVAD, although not for NEC1 in oral cancer cells. EANT causes several oxidative stress events such as reactive oxygen species, mitochondrial superoxide, and mitochondrial membrane depolarization. In response to oxidative stresses, the mRNA for antioxidant signaling, such as nuclear factor erythroid 2-like 2 (NFE2L2), catalase (CAT), heme oxygenase 1 (HMOX1), and thioredoxin (TXN), are overexpressed in oral cancer cells. Moreover, EANT also triggers DNA damage, as detected by γH2AX and 8-oxo-2'-deoxyguanosine adducts. The dependence of oxidative stress is validated by the evidence that NAC pretreatment reverts the changes of cellular and mitochondrial stress and DNA damage. Therefore, EANT exhibits antiproliferation involving an oxidative stress-dependent necrosis/apoptosis switch and DNA damage in oral cancer cells.

Keywords: Nepenthes; apoptosis; necrosis; oral cancer; oxidative stress; preferential killing.


Conflict of interest statement

The authors declare no conflict of interest.

Figures

Figure 1
Figure 1
Cell viability. (A) Cell viability for several oral cancer cell lines and normal oral (HGF-1) cell lines in EANT treatments for 24 h MTS assay. (B) NAC (2 mM) pretreatment outcome of EANT treatments (0 and 25 μg/mL) for 24 h MTS assay. The cell viability of untreated controls for each oral cancer cell line was adjusted to 100%, which is not shown here. Data (means ± SD, n = 3) showing * differ in significance for paired comparisons (p < 0.05).
Figure 2
Figure 2
Cell cycle analysis. (A,B) Cell cycle patterns and statistical analysis for EANT treated oral cancer cells (CAL 27 and Ca9-22) over 24 h. (C,D) NAC (2 mM) pretreatment outcome to cell cycle patterns and statistical analysis in EANT treatments (0 and 25 μg/mL) for 12 and 24 h. Data (means ± SD, n = 3) with different letters on-top indicate significant differences for multiple comparisons (p < 0.05). One-way analysis of variance (ANOVA) with a post hoc test was applied to multiple comparisons. For example (Ca9-22 cells in Figure 2B), the EANT 0, EANT 10, EANT 15, and EANT 20 show “b and ba”, indicating nonsignificant differences between each other because they overlap with the same lowercase letter “b”. Similarly, the EANT 20 and EANT 25 show “ba” and “a”, indicating nonsignificant differences between each other because they overlap with the same lowercase letter “a”. In contrast, EANT 0, EANT 10, and EANT 15 show “b” and EANT 25 shows “a” indicating significant differences among each other because they do not overlap with the same lowercase letter.
Figure 3
Figure 3
Annexin V/7AAD analysis. Q1, Q2, Q3, and Q4 marked in each panel indicate the necrosis, late apoptosis, early apoptosis, and lived cells, respectively. EA, EANT; NE, necrosis; AP, apoptosis (Q2 + Q3). For example, EA-NE and NAC/EA-NE indicate the necrosis (NE) status for EANT (EA) treatment in the absence and presence of NAC, respectively. EA-NE and NEC1/EA-NE indicate the NE status for EA treatment in the absence and presence of NEC1, respectively. EA-NE and ZVAD/EA-NE indicate the NE status for EA treatment in the absence and presence of ZVAD, respectively. (A,B) Annexin V/7AAD pattern and statistical analysis. With the inhibitor pretreatments for oxidative stress, necrosis, and apoptosis (10 mM NAC for 1 h, 50 μM NEC1 for 1 h, and 100 μM ZVAD for 2 h), or not, oral cancer cells (Ca9-22 and CAL 27) were treated with EANT (control, 10, 25 μg/mL) for 24 h. Data (mean ± SD, n = 3) showing different letters on top differ significantly for multiple comparisons (p < 0.05). One-way analysis of variance (ANOVA) with a post hoc test was applied to multiple comparisons. For example (Ca9-22 cells in Figure 3B), the EN-NE (red color) at 0, 10, and 25 μg/mL show “fg, b, and c”, indicating significant differences among each other because they do not overlap with the same lowercase letter. Similar to 25 μg/mL EANT, EA-NE, NAC/EA-NE, EA-AP, and NAC/EA-AP show “g, c, a, and e”, indicating significant differences. In contrast, EA-NE, NAC/EA-NE, EA-AP, and NAC/EA-AP at the control (0 EANT) show “fg”, indicating nonsignificant differences between each other because they overlap with the same lowercase letter “fg”.
Figure 4
Figure 4
Pancaspase activation analysis. (A,B) Pancaspase flow cytometry and statistics. With the inhibitor pretreatments for oxidative stress, necrosis, and apoptosis (10 mM NAC for 1 h, 50 μM NEC1 for 1 h, and 100 μM ZVAD for 2 h), or not, oral cancer cells (Ca9-22 and CAL 27) were treated with EANT (control, 10, 25 μg/mL) for 24 h. Data (mean ± SD, n = 3) showing different letters on-top differ significantly for multiple comparisons (p < 0.05).
Figure 5
Figure 5
ROS analysis. (A,B) ROS pattern and statistical analysis for EANT treated oral cancer cells (CAL 27 and Ca9-22) for 5 min. (C,D) NAC (10 mM) pretreatment outcome to ROS patterns and statistical analysis in EANT treatments (0 and 25 μg/mL) for 0, 0.5, 1, and 5 min. (E) ROS pattern and statistical analysis for EANT treated normal oral (HGF-1) cells for different concentrations (0, 10, 15, 20, and 25 μg/mL for 5 min) and treatment times (25 μg/mL for 0, 0.5, 1, and 5 min) of EANT. Data (means ± SD, n = 3) showing different letters on-top differ significantly for multiple comparisons (p < 0.05).
Figure 6
Figure 6
MitoSOX analysis. (A,B) MitoSOX patterns and statistical analysis for EANT treated oral cancer cells (CAL 27 and Ca9-22) for 5 min. (C,D) NAC (2 mM) pretreatment outcome to MitoSOX patterns and statistical analysis in EANT treatments (0 and 25 μg/mL) for 0, 0.5, 1, and 5 min. Data (mean ± SD, n = 3) showing different letters on-top differ significantly for multiple comparisons (p < 0.05).
Figure 7
Figure 7
MMP analyses. (A,B) MMP patterns and statistical analysis for EANT treated oral cancer cells (CAL 27 and Ca9-22) for 24 h. (C,D) NAC (10 mM) pretreatment outcome on MMP patterns and statistical analysis in EANT treatments (0 and 25 μg/mL) for 0, 12, and 24 h. Data (mean ± SD, n = 3) showing different letters on top differ significantly for multiple comparisons (p < 0.05).
Figure 8
Figure 8
Antioxidant gene expression in EANT treated oral cancer cells. Cells were treated with EANT (control and 25 μg/mL (EANT 25) for 24 h), respectively. Several antioxidant genes were chosen for real-time RT-PCR analysis as indicated. Data (mean ± SD, n = 3) showing different letters on-top differ significantly for multiple comparisons (p < 0.05).
Figure 9
Figure 9
γH2AX analysis. (A,B) γH2AX pattern and statistical analysis for EANT treated oral cancer cells (CAL 27 and Ca9-22) for 24 h. (C,D) NAC (2 mM) pretreatment outcome on γH2AX patterns and statistical analysis in EANT treatments (0 and 25 μg/mL) for 12 and 24 h. Data (means ± SD, n = 3) showing non-overlapping alphabets differ significantly for multiple comparisons (p < 0.05).
Figure 10
Figure 10
8-OHdG analysis. (A,B) 8-OHdG pattern and statistical analysis for EANT-treated oral cancer cells (CAL 27 and Ca9-22) for 24 h. (C,D) NAC (2 mM) pretreatment outcome on 8-OHdG pattern and statistical analysis in EANT treatments (0 and 25 μg/mL) for 12 and 24 h. Data (means ± SD, n = 3) showing different letters on top differ significantly for multiple comparisons (p < 0.05).

References

    1. Kumar M., Nanavati R., Modi T., Dobariya C. Oral cancer: Etiology and risk factors: A review. J. Cancer Res. Ther. 2018 doi: 10.4103/0973-1482.147708. - DOI - PubMed
    1. Silverman S., Jr. Oral cancer: Complications of therapy. Oral Surg. Oral Med. Oral Pathol. Oral Radiol. Endod. 1999;88:122–126. doi: 10.1016/S1079-2104(99)70103-4. - DOI - PubMed
    1. Koeberle A., Werz O. Multi-target approach for natural products in inflammation. Drug Discov. Today. 2014;19:1871–1882. doi: 10.1016/j.drudis.2014.08.006. - DOI - PubMed
    1. Zheng C., Wang J., Liu J., Pei M., Huang C., Wang Y. System-level multi-target drug discovery from natural products with applications to cardiovascular diseases. Mol. Divers. 2014;18:621–635. doi: 10.1007/s11030-014-9521-y. - DOI - PubMed
    1. Chen X., Wang Y., Ma N., Tian J., Shao Y., Zhu B., Wong Y.K., Liang Z., Zou C., Wang J. Target identification of natural medicine with chemical proteomics approach: Probe synthesis, target fishing and protein identification. Signal Transduct. Target. Ther. 2020;5:72. doi: 10.1038/s41392-020-0186-y. - DOI - PMC - PubMed

LinkOut - more resources