. 2021 Sep 9;22(18):9757.
doi: 10.3390/ijms22189757.

Identification of Abundant and Functional dodecaRNAs (doRNAs) Derived from Ribosomal RNA

Affiliations

Identification of Abundant and Functional dodecaRNAs (doRNAs) Derived from Ribosomal RNA

Marine Lambert et al. Int J Mol Sci. .

Abstract

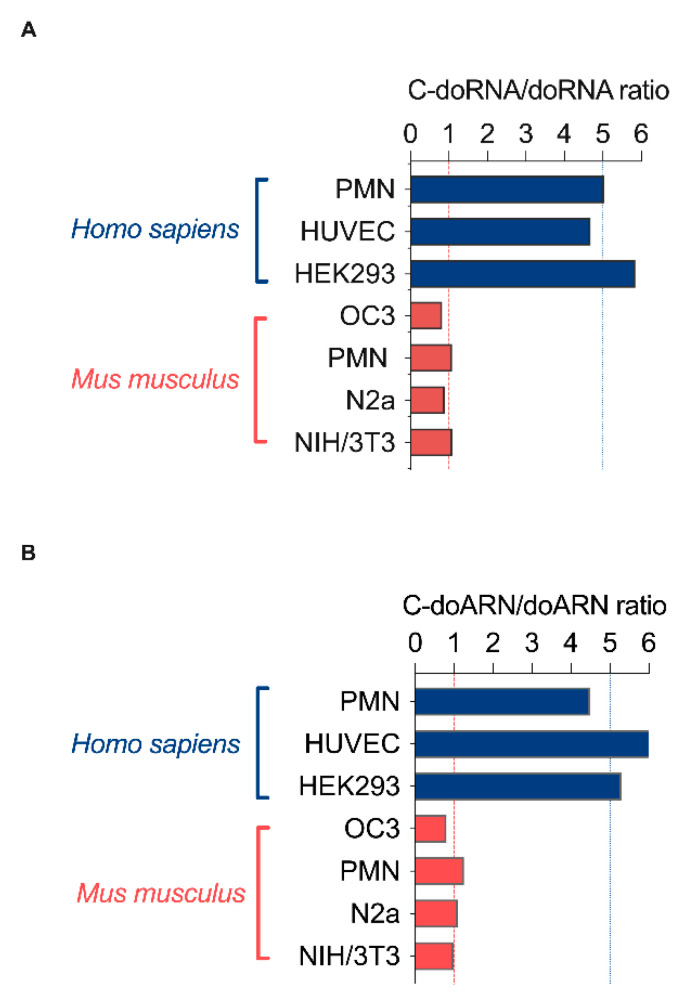
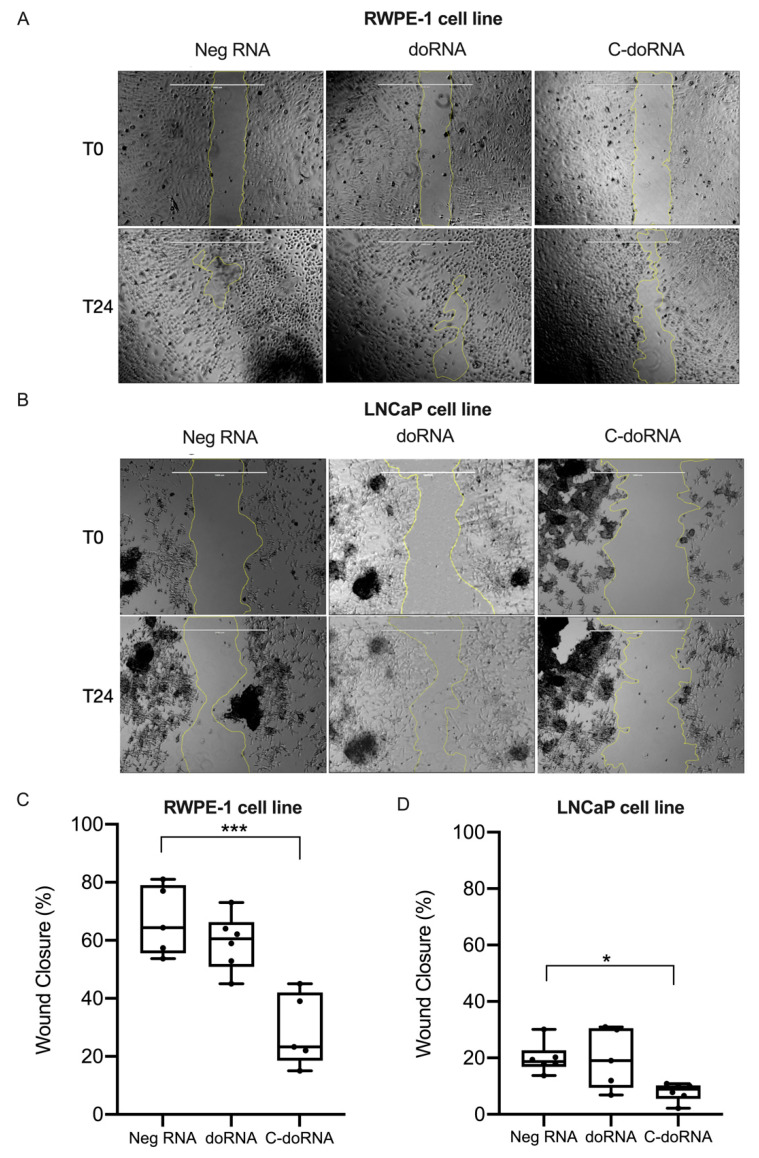
Using a modified RNA-sequencing (RNA-seq) approach, we discovered a new family of unusually short RNAs mapping to ribosomal RNA 5.8S, which we named dodecaRNAs (doRNAs), according to the number of core nucleotides (12 nt) their members contain. Using a new quantitative detection method that we developed, we confirmed our RNA-seq data and determined that the minimal core doRNA sequence and its 13-nt variant C-doRNA (doRNA with a 5' Cytosine) are the two most abundant doRNAs, which, together, may outnumber microRNAs. The C-doRNA/doRNA ratio is stable within species but differed between species. doRNA and C-doRNA are mainly cytoplasmic and interact with heterogeneous nuclear ribonucleoproteins (hnRNP) A0, A1 and A2B1, but not Argonaute 2. Reporter gene activity assays suggest that C-doRNA may function as a regulator of Annexin II receptor (AXIIR) expression. doRNAs are differentially expressed in prostate cancer cells/tissues and may control cell migration. These findings suggest that unusually short RNAs may be more abundant and important than previously thought.

Keywords: 5.8S rRNA; RNA sequencing; RT-qPCR; non-coding RNA; small RNA.


Conflict of interest statement

The authors declare no competing interest.

Figures

Figure 1
Figure 1
Relative abundance of 12 and 13 nt sRNA sequences obtained by sRNA-seq analyses of 11 different biological samples derived from 6 different species. (A) RPM abundance of RNA of 8 to 30 nt from 11 samples. (B) Relative abundance of 12-nt, 13-nt and other RNAs, expressed as RPM. (C) Relative proportion of the most abundant 12-nt RNA (RNA a) and 13-nt RNA (RNA b), compared with the other 12-nt and 13-nt RNAs detected by sRNA-seq (% of total reads). PMN, polymorphonuclear leukocytes; PMP, platelet-derived microparticles; HUVEC, human umbilical vein endothelial cells; HEK293, human embryonic kidney 293 cells; OC3, Old Cerebellum 3; N2a, mouse neuroblastoma cells; NIH/3T3, mouse embryonic fibroblast cells.
Figure 2
Figure 2
doRNA and C-doRNA sequences map to the 5′ end of the 5.8S rRNA. Schematic representation of doRNA and C-doRNA sequence alignment on the 45S rRNA in humans, mice and flies, using NCBI Nucleotide Reference Sequence (RefSeq) database. ETS, external transcribed spacer; ITS, internal transcribed spacer; rRNA, ribosomal RNA.
Figure 3
Figure 3
C-doRNA/doRNA ratio in human and mouse samples. (A) Calculated C-doRNA/doRNA ratio in human and mouse samples from the read count in RNA sequencing. (B) Calculated C-doRNA/doRNA ratio in human and mouse samples analyzed by splinted ligation RT-qPCR. Copy number of each RNA was calculated using a standard curve produced by a serial dilution of the synthetic form of each RNA. PMN, polymorphonuclear leukocytes; HUVEC, human umbilical vein endothelial cells; HEK293, human embryonic kidney 293 cells; OC3, old Cerebellum 3; N2a, mouse neuroblastoma cells; NIH/3T3, mouse embryonic fibroblast cells.
Figure 4
Figure 4
Identification of hnRNP A0, A1 and A2B1 as doRNA and C-doRNA-interacting proteins. (A) Pull-down experiments using 5′ or 3′ biotinylated doRNA, C-doRNA or negative RNA (Neg) and mouse brain extracts, using streptavidin beads. (B) Venn diagram showing the number of proteins interacting with doRNA and/or C-doRNA, and not with Neg RNA. (C,D) The most promising interacting protein candidates identified by LC/MS-MS were validated by Western blot analysis of the pull-downs using monoclonal antibodies against hnRNP A0, A1 and A2B1. Band intensity was quantitated using ImageJ (n = 3 independent experiments). * p < 0.05, ** p = 0.0044 (one-way ANOVA with Holm Sidak’s post-hoc test).
Figure 5
Figure 5
Detection of doRNA and C-doRNA in hnRNP A0, A1 and A2B1, but not Ago2, complexes by reciprocal RNA immunoprecipitation. (AD) Immunoprecipitation of hnRNP A0 (A), A1 (B) or A2B1 (C) proteins, or Ago2 (D) proteins, from mouse brain extracts, followed by splinted ligation RT-qPCR detection of doRNA and C-doRNA. Changes in the level of coimmunoprecipitating doRNA and C-doRNA was expressed as fold change versus the control IgG IP (n = 3 independent experiments). * p < 0.05; ** p < 0.005; *** p < 0.0005 (Student’s t-test).
Figure 6
Figure 6
Cytoplasmic/perinuclear localization of fluorescently labeled doRNA and C-doRNA after transfection in cultured neuronal N2a cells. (A) Localization of doRNA, C-doRNA or negative RNA (Neg; control) coupled at their 3′ end with the Cy3 fluorophore (in red) in transfected N2a cells 24 h prior to confocal fluorescence microscopy. Cell membranes were labeled with the marker PKH-67 (in green), whereas cell nuclei were labeled with 4′,6-diamidino-2-phenylindole (DAPI). RNA localization was visualized using a confocal microscope with a 63× g magnification. (B) Quantitation of the red dots corresponding to doRNA, C-doRNA or negative RNA in the nuclear or cytoplasmic compartments (n = 30 cells, from 3 independent experiments). *** p = 0.0006, **** p < 0.0001 (two-way ANOVA with Holm Sidak’s post-hoc test). (C) RT-qPCR quantitation of doRNA, C-doRNA, rRNAs 28S, 5.8Sl, 5.8Sl, 18S, their 45S rRNA precursor, and the MBII-239 snoRNA control in the cytoplasmic and nuclear fractions of N2a cells (n = 4 independent experiments). **** p < 0.0001 (two-way ANOVA with Holm Sidak’s post-hoc test). (D) Schematic representation of the proposed cellular localization of doRNA and C-doRNA relative to their precursors in mammalian cells.
Figure 7
Figure 7
C-doRNA slightly impairs reporter gene expression controlled by the Annexin II receptor (AXIIR) 5′ UTR. (A) Schematic representation of AXIIR 5′ UTR sequence cloned into the dual-luciferase reporter gene expression psiCHECK-2 vector. (B) Synthetic doRNA, C-doRNA or negative RNA (Neg) control was transfected in cultured N2a cells overexpressing (or not; empty vector) hnRNP A0 as well as the Firefly (Fluc; hluc+) and Renilla (Rluc; hRluc, control) luciferase reporter genes. Fluc activity was normalized on Rluc activity, and the data expressed as % of control (Neg RNA + pCMV-Mock); n = 3 independent experiments. * p < 0.05; ns, not significant (two-way ANOVA with Holm Sidak’s post-hoc test). (C) doRNA, C-doRNA or negative RNA (Neg) control was transfected in cultured N2a cells with the psiCHECK-2 vector. Fluc activity was normalized on Rluc activity, and the data expressed as % of the Neg control; n = 3 independent experiments. * p < 0.05; ns, not significant (two-way ANOVA with Holm Sidak’s post-hoc test).
Figure 8
Figure 8
C-doRNA levels do not varied whereas doRNA levels are reduced in prostate cancer tissues. doRNA and C-doRNA were quantitated in normal (n = 10) and cancerous (n = 13) prostate tissue samples. * p < 0.005; ns, not significant (Student’s t-test).
Figure 9
Figure 9
C-doRNA reduces wound closure upon scratching of confluent culture of prostate cells. (AD) RWPE-1 (A,C) and LNCaP (B,D) cells were transfected with negative RNA (Neg), doRNA, C-doRNA or sponge RNA. (A,B) Images were captured by a camera coupled to a view INV100 microscope, with 40× magnification, immediately after (T0) and 24 h after (T24) performing a scratch. Scale bar are 1000µm for all pictures. (C,D) The images were analyzed using the ImageJ software to evaluate the closure of the scratch by quantitating the areas devoid of cell coverage. n = 6 independent experiments. * p < 0.05; *** p < 0.0005 (two-way ANOVA with Holm Sidak’s post-hoc test).

References

    1. Venter J.C., Adams M.D., Myers E.W., Li P.W., Mural R.J., Sutton G.G., Smith H.O., Yandell M., Evans C.A., Holt R.A., et al. The sequence of the human genome. Science. 2001;291:1304–1351. doi: 10.1126/science.1058040. - DOI - PubMed
    1. Lander E.S., Linton L.M., Birren B., Nusbaum C., Zody M.C., Baldwin J., Devon K., Dewar K., Doyle M., FitzHugh W., et al. Initial sequencing and analysis of the human genome. Nature. 2001;409:860–921. doi: 10.1038/35057062. - DOI - PubMed
    1. Djebali S., Davis C.A., Merkel A., Dobin A., Lassmann T., Mortazavi A., Tanzer A., Lagarde J., Lin W., Schlesinger F., et al. Landscape of transcription in human cells. Nature. 2012;489:101–108. doi: 10.1038/nature11233. - DOI - PMC - PubMed
    1. Waterston R.H., Lindblad-Toh K., Birney E., Rogers J., Abril J.F., Agarwal P., Agarwala R., Ainscough R., Alexandersson M., An P., et al. Initial sequencing and comparative analysis of the mouse genome. Nature. 2002;420:520–562. doi: 10.1038/nature01262. - DOI - PubMed
    1. Carninci P., Kasukawa T., Katayama S., Gough J., Frith M.C., Maeda N., Oyama R., Ravasi T., Lenhard B., Wells C., et al. The Transcriptional Landscape of the Mammalian Genome. Science. 2005;309:1559–1563. doi: 10.1126/science.1112014. - DOI - PubMed