. 2021 Sep 12;22(18):9850.
doi: 10.3390/ijms22189850.

Pharmacological Characterization of Low Molecular Weight Biased Agonists at the Follicle Stimulating Hormone Receptor

Affiliations

Pharmacological Characterization of Low Molecular Weight Biased Agonists at the Follicle Stimulating Hormone Receptor

Francesco De Pascali et al. Int J Mol Sci. .

Abstract

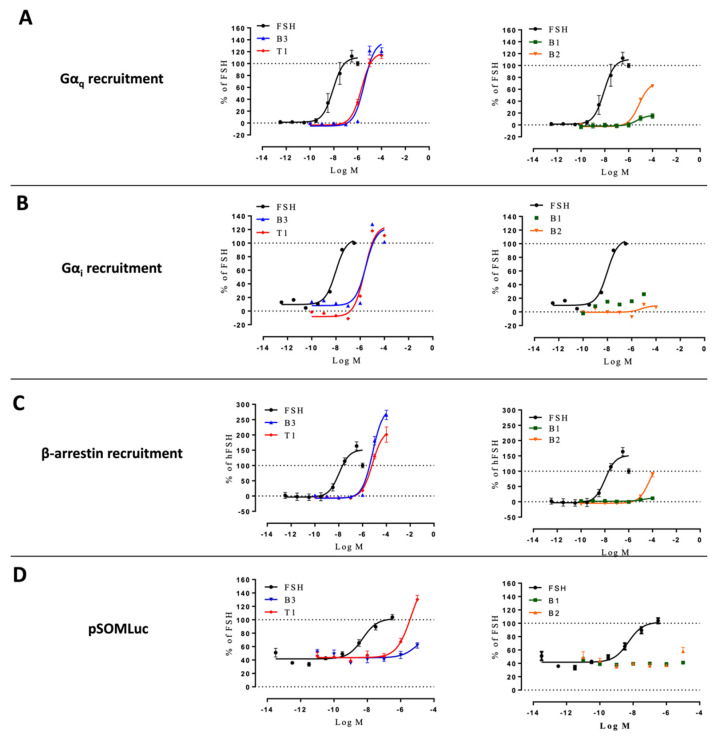
Follicle-stimulating hormone receptor (FSHR) plays a key role in reproduction through the activation of multiple signaling pathways. Low molecular weight (LMW) ligands composed of biased agonist properties are highly valuable tools to decipher complex signaling mechanisms as they allow selective activation of discrete signaling cascades. However, available LMW FSHR ligands have not been fully characterized yet. In this context, we explored the pharmacological diversity of three benzamide and two thiazolidinone derivatives compared to FSH. Concentration/activity curves were generated for Gαs, Gαq, Gαi, β-arrestin 2 recruitment, and cAMP production, using BRET assays in living cells. ERK phosphorylation was analyzed by Western blotting, and CRE-dependent transcription was assessed using a luciferase reporter assay. All assays were done in either wild-type, Gαs or β-arrestin 1/2 CRISPR knockout HEK293 cells. Bias factors were calculated for each pair of read-outs by using the operational model. Our results show that each ligand presented a discrete pharmacological efficacy compared to FSH, ranging from super-agonist for β-arrestin 2 recruitment to pure Gαs bias. Interestingly, LMW ligands generated kinetic profiles distinct from FSH (i.e., faster, slower or transient, depending on the ligand) and correlated with CRE-dependent transcription. In addition, clear system biases were observed in cells depleted of either Gαs or β-arrestin genes. Such LMW properties are useful pharmacological tools to better dissect the multiple signaling pathways activated by FSHR and assess their relative contributions at the cellular and physio-pathological levels.

Keywords: FSHR; allosteric ligands; biased signaling; operational model; system bias.


Conflict of interest statement

S.G.N., H.N.Y. and S.S.P. were founders and employees of TocopheRx Inc.

Figures

Figure 1
Figure 1
Chemical structures of LMW ligands used in the study. B1, B2, B3 are Benzamide derivatives; T1 is a Thiazolidinone derivative, and T2 is an antagonist obtained by chemically modifying T1.
Figure 2
Figure 2
Profiling of LMW ligands vs. FSH in HEK293 cells. (A) Gαs recruitment (light blue), (B) Gαq recruitment (green), (C) Gαi recruitment (purple), (D) β-arrestin 2 recruitment (grey), and (E) cAMP production were measured. HEK293 cells transfected with the FSHR and the appropriate BRET sensors (Rluc stands for renilla luciferase, YFP for yellow fluorescent protein, and EPAC for exchange protein directly activated by cAMP) were challenged with increasing doses of FSH (10−12.5 to 10−6.5 M) or LMW ligands (10−10 to 10−4 M). Concentration/activity curves were measured for the different read-outs. Signals were monitored for 30 min and normalized, considering the FSH maximal response as 100%. The area under the concentration/activity curves generated by each compound was plotted and fitted using non-linear regression. Data are represented as mean ± SEM from at least six independent experiments.
Figure 3
Figure 3
Kinetics curves induced by EC80 of FSH and LMW ligands. (A) Gαs recruitment, (B) Gαq recruitment, (C) Gαi recruitment, (D) β-arrestin 2 recruitment, and (E) cAMP production were measured. HEK293 cells transfected with FSHR and appropriate BRET sensors were stimulated with EC80 of FSH or LMW ligands. Signals were monitored for 20 to 40 min, depending on the read-out. Kinetic curves corresponding to each read-out were normalized considering the signal elicited by FSH at 20 min as 100%. Kinetics curves were plotted as a function of time. Data are represented as mean ± SEM from at least six independent experiments.
Figure 4
Figure 4
Concentration/activity curves of T1 vs. FSH at different time points. Gαs recruitment (A) and cAMP production (B) were measured at 2, 7, and 20 min of stimulation. Efficacies and potencies were compared (C). The area under the concentration/activity curves generated by T1 at the different endpoints considered (2, 7, and 20 min) were calculated. FSH maximal response at each endpoint was set at 100%, and T1-induced values were normalized accordingly. Normalized values were plotted and fitted using non-linear regression. Emax values were represented as the % of FSH Emax ± SEM. Potency values were represented as the positive logarithm of the ligand EC50 concentration ± SEM for each time considered. Statistical significance was assessed by unpaired t-test with Welch’s correction. n = 6, * p < 0.05; *** p < 0.001.
Figure 5
Figure 5
Activity of FSH vs. LMW ligands on downstream signaling. (A) HEK293 cells expressing the FSHR were stimulated with EC80 concentration of FSH or LMW ligands for 5 min. ERK phosphorylation was analyzed by western blotting. (B) Images were quantified and represented as normalized phosphorylated ERK/ERK1/2 values. (C) HEK293 co-expressing the FSHR and CRE-luciferase reporter gene were stimulated with increasing concentrations of FSH (10−12.5 to 10−6.5 M) or LMW ligands (10−10 to 10−4 M). Luciferase activities were recorded 6 h after stimulation, and signals were normalized over FSH maximal response. Values were plotted and fitted by non-linear regression. Data are represented as mean ± SEM from at least six independent experiments.
Figure 6
Figure 6
Profiling of LMW ligands vs. FSH in HEK293/ΔGαs cells. (A) Gαq recruitment, (B) Gαi recruitment, (C) β-arrestin 2 recruitment, and (D) CRE reporter gene induction were measured. Transfected HEK293/ΔGαs cells were challenged with increasing doses of FSH (10−12.5 to 10−6.5 M) or LMW ligands (10−10 to 10−4 M). Signals were monitored for 30 min. Concentration/activity curves were calculated by considering the area under the curves. Values were normalized considering FSH maximal response as 100%, plotted, and fitted using non-linear regression. Data are represented as mean ± SEM from at least six independent experiments.
Figure 7
Figure 7
Profiling of LMW ligands vs. FSH in HEK293/ΔARRB cells. (A) Gαs recruitment, (B) Gαq recruitment, (C) Gαi recruitment, (D) cAMP production, and (E) CRE reporter gene induction were measured. Transfected HEK293/ΔARRB cells were challenged with increasing doses of FSH (10−12.5 to 10−6.5 M) or LMW ligands (10−10 to 10−4 M). Signals were monitored for 30 min. Concentration/activity curves were calculated by considering the area under the curves. Values were normalized considering FSH maximal response as 100%, plotted, and fitted using non-linear regression. Data are represented as mean ± SEM from at least six independent experiments.
Figure 8
Figure 8
Radial graph representation of FSH and LMW ligand-induced transduction coefficients (TC) and maximal efficacies (Emax). Transduction coefficients and maximal efficacies were obtained after curve-fitting of FSH and LMW ligand-induced concentration/activity curves and are represented as radial graphs. Radius for TC is in logarithmic scale while radius for Emax is normalized, considering FSH maximal response as 100%, and is shown in linear scale. B1-induced transduction coefficients in HEK293/ΔGαs were not identifiable, and the relative radial graph was labeled as “not determined” (nd).
Figure 9
Figure 9
Graphic representation of the biased pharmacological behavior induced by LMW ligands. The biased pharmacological behavior of each LMW (represented in a color code, B1 = green, B2 = orange, B3 = blue and T1 = red) ligand is represented in the shape of an arrow pointing to the direction of bias for each of the pair of read-outs considered in the three cellular contexts. Statistically significant biases (full arrow) as well as observed biases (empty arrow) are shown.
Figure 10
Figure 10
Hierarchical clustering and principal component analysis of LMW ligand-induced bias factors. Continuous lines represent the cut-off set up of a number of clusters equal to three. Clusters of ligands are highlighted with dotted lines. Note that in the PCA graph, corresponding to HEK293/ΔGαs, FSH and B1 are perfectly overlaid.

References

    1. Gromoll J., Simoni M., Nordhoff V., Behre H.M., De Geyter C., Nieschlag E. Functional and Clinical Consequences of Mutations in the FSH Receptor. Mol. Cell. Endocrinol. 1996;125:177–182. doi: 10.1016/S0303-7207(96)03949-4. - DOI - PubMed
    1. Kaprara A., Huhtaniemi I.T. The Hypothalamus-Pituitary-Gonad Axis: Tales of Mice and Men. Metabolism. 2017;86:3–17. doi: 10.1016/j.metabol.2017.11.018. - DOI - PubMed
    1. Fan Q.R., Hendrickson W.A. Structure of Human Follicle-Stimulating Hormone in Complex with Its Receptor. Nature. 2005;433:269–277. doi: 10.1038/nature03206. - DOI - PMC - PubMed
    1. Gloaguen P., Crépieux P., Heitzler D., Poupon A., Reiter E. Mapping the Follicle-Stimulating Hormone-Induced Signaling Networks. Front. Endocrinol. 2011;2:45. doi: 10.3389/fendo.2011.00045. - DOI - PMC - PubMed
    1. Landomiel F., De Pascali F., Raynaud P., Jean-Alphonse F., Yvinec R., Pellissier L.P., Bozon V., Bruneau G., Crépieux P., Poupon A., et al. Biased Signaling and Allosteric Modulation at the FSHR. Front. Endocrinol. 2019;10:148. doi: 10.3389/fendo.2019.00148. - DOI - PMC - PubMed

MeSH terms

LinkOut - more resources