Impact of Oncogenic Targets by Tumor-Suppressive miR-139-5p and miR-139-3p Regulation in Head and Neck Squamous Cell Carcinoma
- PMID: 34576110
- PMCID: PMC8469660
- DOI: 10.3390/ijms22189947
Impact of Oncogenic Targets by Tumor-Suppressive miR-139-5p and miR-139-3p Regulation in Head and Neck Squamous Cell Carcinoma
Abstract
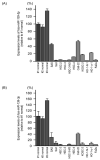
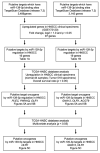
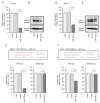
We newly generated an RNA-sequencing-based microRNA (miRNA) expression signature of head and neck squamous cell carcinoma (HNSCC). Analysis of the signature revealed that both strands of some miRNAs, including miR-139-5p (the guide strand) and miR-139-3p (the passenger strand) of miR-139, were downregulated in HNSCC tissues. Analysis of The Cancer Genome Atlas confirmed the low expression levels of miR-139 in HNSCC. Ectopic expression of these miRNAs attenuated the characteristics of cancer cell aggressiveness (e.g., cell proliferation, migration, and invasion). Our in silico analyses revealed a total of 28 putative targets regulated by pre-miR-139 (miR-139-5p and miR-139-3p) in HNSCC cells. Of these, the GNA12 (guanine nucleotide-binding protein subunit alpha-12) and OLR1 (oxidized low-density lipoprotein receptor 1) expression levels were identified as independent factors that predicted patient survival according to multivariate Cox regression analyses (p = 0.0018 and p = 0.0104, respectively). Direct regulation of GNA12 and OLR1 by miR-139-3p in HNSCC cells was confirmed through luciferase reporter assays. Moreover, overexpression of GNA12 and OLR1 was detected in clinical specimens of HNSCC through immunostaining. The involvement of miR-139-3p (the passenger strand) in the oncogenesis of HNSCC is a new concept in cancer biology. Our miRNA-based strategy will increase knowledge on the molecular pathogenesis of HNSCC.
Keywords: GNA12; HNSCC; OLR1; expression signature; miR-139-3p; miR-139-5p; microRNA; passenger strand; tumor suppressor.
Conflict of interest statement
The authors declare no conflict of interest.
Figures


Similar articles
-
Identification of miR-199-5p and miR-199-3p Target Genes: Paxillin Facilities Cancer Cell Aggressiveness in Head and Neck Squamous Cell Carcinoma.Genes (Basel). 2021 Nov 27;12(12):1910. doi: 10.3390/genes12121910. Genes (Basel). 2021. PMID: 34946859 Free PMC article.
-
Antitumor miR-150-5p and miR-150-3p inhibit cancer cell aggressiveness by targeting SPOCK1 in head and neck squamous cell carcinoma.Auris Nasus Larynx. 2018 Aug;45(4):854-865. doi: 10.1016/j.anl.2017.11.019. Epub 2017 Dec 9. Auris Nasus Larynx. 2018. PMID: 29233721
-
Regulation of Oncogenic Targets by miR-99a-3p (Passenger Strand of miR-99a-Duplex) in Head and Neck Squamous Cell Carcinoma.Cells. 2019 Nov 28;8(12):1535. doi: 10.3390/cells8121535. Cells. 2019. PMID: 31795200 Free PMC article.
-
Role of Cancer Associated Fibroblast (CAF) derived miRNAs on head and neck malignancies microenvironment: a systematic review.BMC Cancer. 2025 Apr 1;25(1):582. doi: 10.1186/s12885-025-13965-9. BMC Cancer. 2025. PMID: 40169971 Free PMC article.
-
MiR-136-5p in cancer: Roles, mechanisms, and chemotherapy resistance.Gene. 2024 May 30;909:148265. doi: 10.1016/j.gene.2024.148265. Epub 2024 Feb 10. Gene. 2024. PMID: 38346459 Review.
Cited by
-
Exosomal AC068768.1 enhances the proliferation, migration, and invasion of laryngeal squamous cell carcinoma through miR-139-5p/NOTCH1 axis.Heliyon. 2024 Aug 15;10(16):e36358. doi: 10.1016/j.heliyon.2024.e36358. eCollection 2024 Aug 30. Heliyon. 2024. PMID: 39258189 Free PMC article.
-
Identification of miR-199-5p and miR-199-3p Target Genes: Paxillin Facilities Cancer Cell Aggressiveness in Head and Neck Squamous Cell Carcinoma.Genes (Basel). 2021 Nov 27;12(12):1910. doi: 10.3390/genes12121910. Genes (Basel). 2021. PMID: 34946859 Free PMC article.
-
Identification of Antitumor miR-30e-5p Controlled Genes; Diagnostic and Prognostic Biomarkers for Head and Neck Squamous Cell Carcinoma.Genes (Basel). 2022 Jul 9;13(7):1225. doi: 10.3390/genes13071225. Genes (Basel). 2022. PMID: 35886008 Free PMC article.
-
Impact of miR-1/miR-133 Clustered miRNAs: PFN2 Facilitates Malignant Phenotypes in Head and Neck Squamous Cell Carcinoma.Biomedicines. 2022 Mar 12;10(3):663. doi: 10.3390/biomedicines10030663. Biomedicines. 2022. PMID: 35327465 Free PMC article.
-
Molecular Pathogenesis of Colorectal Cancer: Impact of Oncogenic Targets Regulated by Tumor Suppressive miR-139-3p.Int J Mol Sci. 2022 Oct 1;23(19):11616. doi: 10.3390/ijms231911616. Int J Mol Sci. 2022. PMID: 36232922 Free PMC article.
References
-
- Cohen E.E.W., Bell R.B., Bifulco C.B., Burtness B., Gillison M.L., Harrington K.J., Le Q.T., Lee N.Y., Leidner R., Lewis R.L., et al. The Society for Immunotherapy of Cancer consensus statement on immunotherapy for the treatment of squamous cell carcinoma of the head and neck (HNSCC) J. Immunother. Cancer. 2019;7:184. doi: 10.1186/s40425-019-0662-5. - DOI - PMC - PubMed
-
- Wang X., Guo J., Yu P., Guo L., Mao X., Wang J., Miao S., Sun J. The roles of extracellular vesicles in the development, microenvironment, anticancer drug resistance, and therapy of head and neck squamous cell carcinoma. J. Exp. Clin. Cancer Res. 2021;40:35. doi: 10.1186/s13046-021-01840-x. - DOI - PMC - PubMed
-
- Bonner J.A., Harari P.M., Giralt J., Cohen R.B., Jones C.U., Sur R.K., Raben D., Baselga J., Spencer S.A., Zhu J., et al. Radiotherapy plus cetuximab for locoregionally advanced head and neck cancer: 5-year survival data from a phase 3 randomised trial, and relation between cetuximab-induced rash and survival. Lancet Oncol. 2010;11:21–28. doi: 10.1016/S1470-2045(09)70311-0. - DOI - PubMed
MeSH terms
Substances
Grants and funding
LinkOut - more resources
Full Text Sources
Medical
Molecular Biology Databases
Research Materials

