

Beneficial Effects of Tamarind Trypsin Inhibitor in Chitosan-Whey Protein Nanoparticles on Hepatic Injury Induced High Glycemic Index Diet: A Preclinical Study
- PMID: 34576130
- PMCID: PMC8470918
- DOI: 10.3390/ijms22189968
Beneficial Effects of Tamarind Trypsin Inhibitor in Chitosan-Whey Protein Nanoparticles on Hepatic Injury Induced High Glycemic Index Diet: A Preclinical Study
Abstract
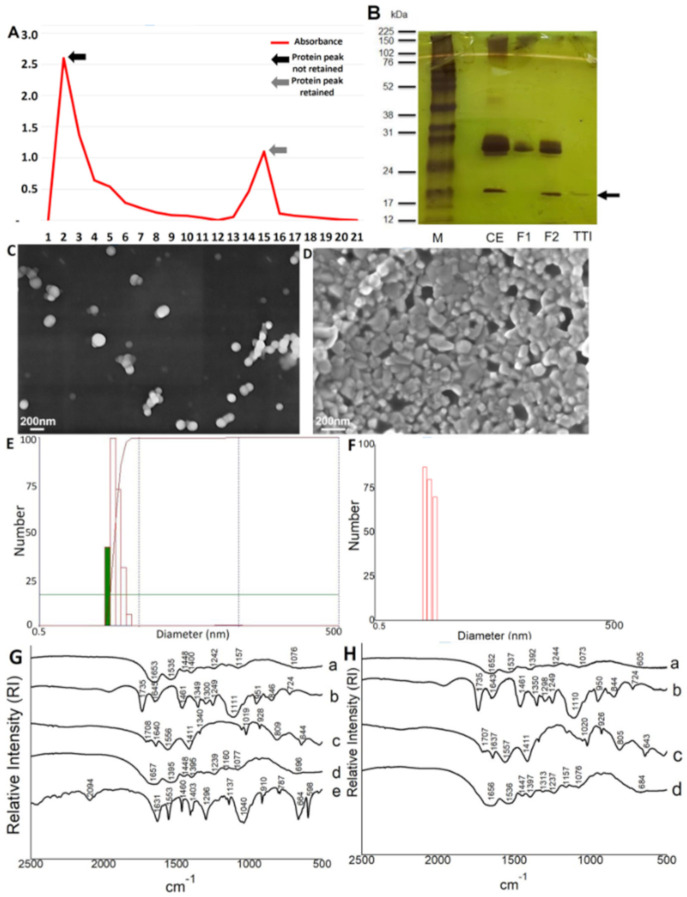
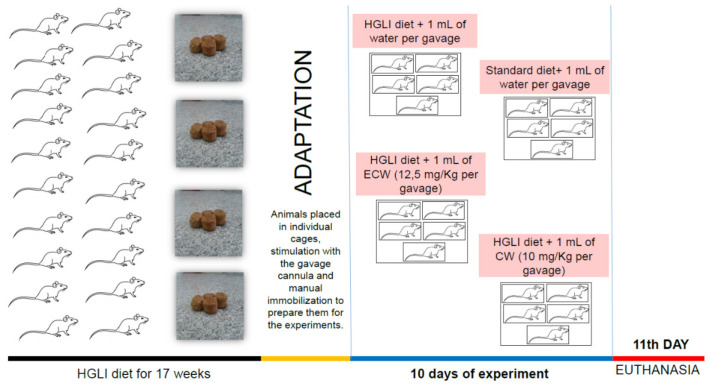
Several studies have sought new therapies for obesity and liver diseases. This study investigated the effect of the trypsin inhibitor isolated from tamarind seeds (TTI), nanoencapsulated in chitosan and whey protein isolate (ECW), on the liver health status of the Wistar rats fed with a high glycemic index (HGLI) diet. The nanoformulations without TTI (CW) and ECW were obtained by nanoprecipitation technique, physically and chemically characterized, and then administered to the animals. The adult male Wistar rats (n = 20) were allocated to four groups: HGLI diet + water; standard diet + water; HGLI diet + ECW (12.5 mg/kg); and HGLI diet + CW (10.0 mg/kg), 1 mL per gagave, for ten days. They were evaluated using biochemical and hematological parameters, Fibrosis-4 Index for Liver Fibrosis (FIB-4), AST to Platelet Ratio Index (APRI) scores, and liver morphology. Both nanoparticles presented spherical shape, smooth surface, and nanometric size [120.7 nm (ECW) and 136.4 nm (CW)]. In animals, ECW reduced (p < 0.05) blood glucose (17%), glutamic oxalacetic transaminase (39%), and alkaline phosphatase (24%). Besides, ECW reduced (p < 0.05) APRI and FIB-4 scores and presented a better aspect of hepatic morphology. ECW promoted benefits over a liver injury caused by the HGLI diet.
Keywords: hyperglycemia; nanoencapsulation; protease inhibitor.
Conflict of interest statement
The authors declare no conflict of interest.
Figures


Similar articles
-
Tamarind Trypsin Inhibitor in Chitosan-Whey Protein Nanoparticles Reduces Fasting Blood Glucose Levels without Compromising Insulinemia: A Preclinical Study.Nutrients. 2019 Nov 14;11(11):2770. doi: 10.3390/nu11112770. Nutrients. 2019. PMID: 31739532 Free PMC article.
-
Nanoparticles Loaded with a Carotenoid-Rich Extract from Cantaloupe Melon Improved Hepatic Retinol Levels in a Diet-Induced Obesity Preclinical Model.ACS Omega. 2023 Jul 26;8(31):28475-28486. doi: 10.1021/acsomega.3c02750. eCollection 2023 Aug 8. ACS Omega. 2023. PMID: 37576634 Free PMC article.
-
Anti-TNF-α Agent Tamarind Kunitz Trypsin Inhibitor Improves Lipid Profile of Wistar Rats Presenting Dyslipidemia and Diet-induced Obesity Regardless of PPAR-γ Induction.Nutrients. 2019 Feb 27;11(3):512. doi: 10.3390/nu11030512. Nutrients. 2019. PMID: 30818882 Free PMC article.
-
Satietogenic Protein from Tamarind Seeds Decreases Food Intake, Leptin Plasma and CCK-1r Gene Expression in Obese Wistar Rats.Obes Facts. 2018;11(6):440-453. doi: 10.1159/000492733. Epub 2018 Dec 11. Obes Facts. 2018. PMID: 30537704 Free PMC article.
-
The Effect of Low Glycemic Index and Glycemic Load Diets on Hepatic Fat Mass, Insulin Resistance, and Blood Lipid Panels in Individuals with Nonalcoholic Fatty Liver Disease.Metab Syndr Relat Disord. 2019 Oct;17(8):389-396. doi: 10.1089/met.2019.0038. Epub 2019 Jul 15. Metab Syndr Relat Disord. 2019. PMID: 31305201 Review.
Cited by
-
Acute toxicity of trypsin inhibitor from tamarind seeds in embryo and adult zebrafish (Danio rerio).Toxicol Rep. 2024 Oct 10;13:101766. doi: 10.1016/j.toxrep.2024.101766. eCollection 2024 Dec. Toxicol Rep. 2024. PMID: 39469098 Free PMC article.
-
Nanoparticles Containing Tamarind Isolate Protein Potentiate the Satiety without Promoting the Anti-Inflammatory Effect in a Preclinical Model of Diet-Induced Obesity.Foods. 2022 Nov 5;11(21):3526. doi: 10.3390/foods11213526. Foods. 2022. PMID: 36360138 Free PMC article.
-
Whey Protein Isolate-Chitosan PolyElectrolyte Nanoparticles as a Drug Delivery System.Molecules. 2023 Feb 11;28(4):1724. doi: 10.3390/molecules28041724. Molecules. 2023. PMID: 36838712 Free PMC article.
-
Encapsulated Peptides and Proteins with an Effect on Satiety.Nanomaterials (Basel). 2023 Mar 24;13(7):1166. doi: 10.3390/nano13071166. Nanomaterials (Basel). 2023. PMID: 37049259 Free PMC article. Review.
-
An Insulin Receptor-Binding Multifunctional Protein from Tamarindus indica L. Presents a Hypoglycemic Effect in a Diet-Induced Type 2 Diabetes-Preclinical Study.Foods. 2022 Jul 25;11(15):2207. doi: 10.3390/foods11152207. Foods. 2022. PMID: 35892791 Free PMC article.
References
-
- Soares L.R., Luiza M., Pereira C., Mota M.A., Jacob A., Yuri V., Kashiwabara T.G.B. A transição da desnutrição para a obesidade. [(accessed on 18 August 2021)];Braz J. Surg. Clin. Res. 2014 5:64–68. Available online: https://www.mastereditora.com.br/periodico/20131130_150631.pdf.
-
- Ng M., Fleming T., Robinson M., Thomson B., Graetz N., Margono C., Mullany E.C., Biryukov S., Abbafati C., Abera S.F., et al. Global, regional, and national prevalence of overweight and obesity in children and adults during 1980–2013: A systematic analysis for the Global Burden of Disease Study 2013. Lancet. 2014;384:766–781. doi: 10.1016/S0140-6736(14)60460-8. - DOI - PMC - PubMed
MeSH terms
Substances
Grants and funding
LinkOut - more resources
Full Text Sources
