. 2021 Sep 15;22(18):9982.
doi: 10.3390/ijms22189982.

Celiac Disease Defined by Over-Sensitivity to Gliadin Activation and Superior Antigen Presentation of Dendritic Cells

Affiliations

Celiac Disease Defined by Over-Sensitivity to Gliadin Activation and Superior Antigen Presentation of Dendritic Cells

Michael Hudec et al. Int J Mol Sci. .

Abstract

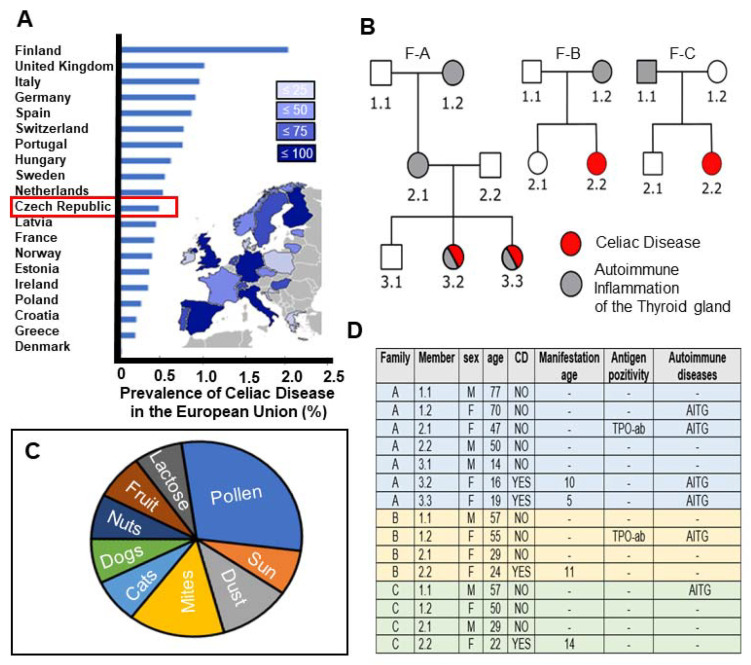
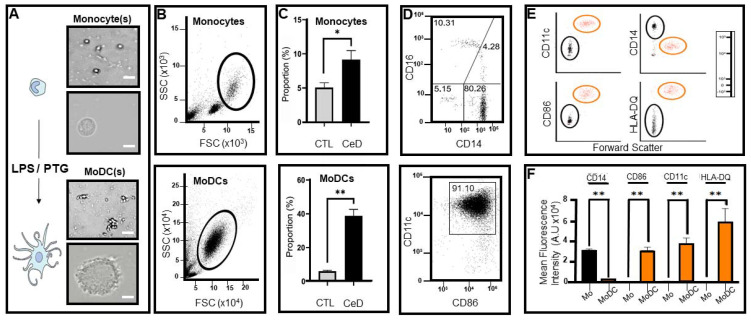
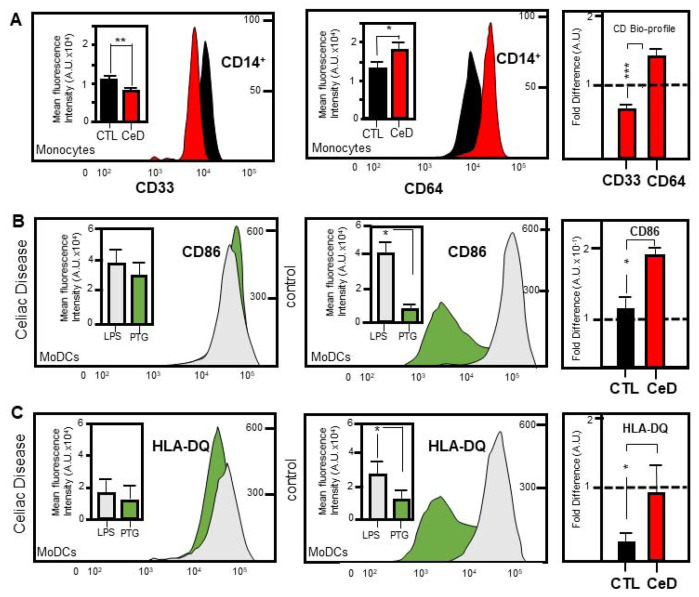
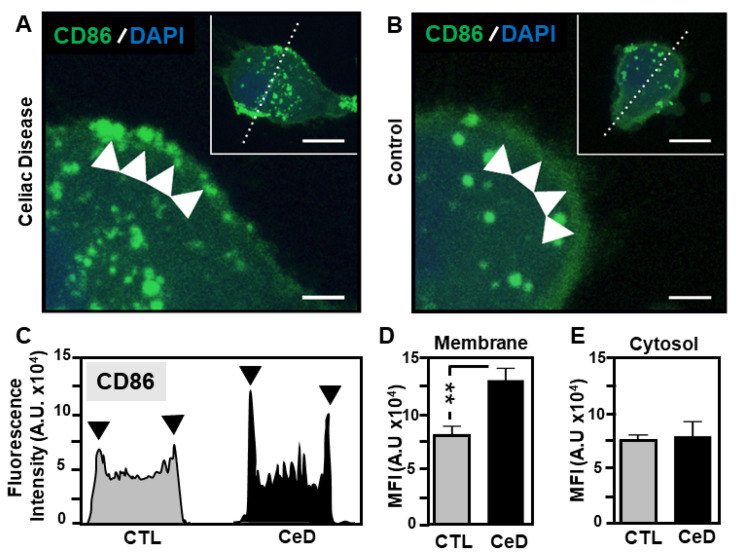
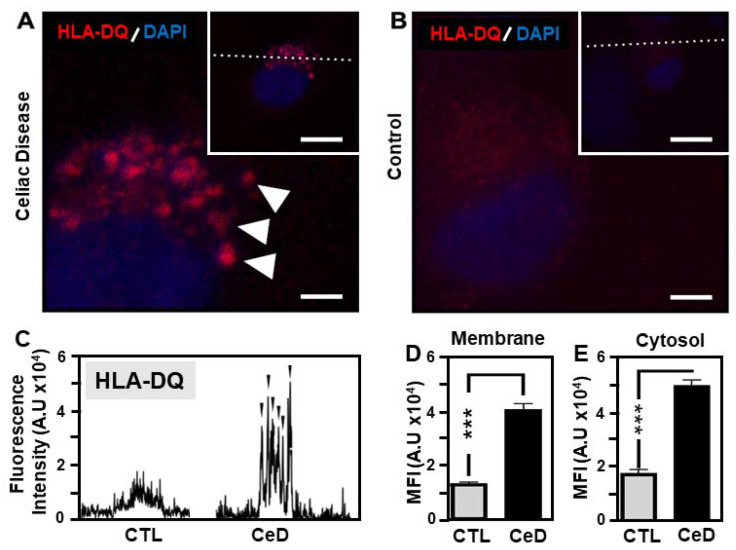
The autoimmune condition, Celiac Disease (CeD), displays broad clinical symptoms due to gluten exposure. Its genetic association with DQ variants in the human leukocyte antigen (HLA) system has been recognised. Monocyte-derived mature dendritic cells (MoDCs) present gluten peptides through HLA-DQ and co-stimulatory molecules to T lymphocytes, eliciting a cytokine-rich microenvironment. Having access to CeD associated families prevalent in the Czech Republic, this study utilised an in vitro model to investigate their differential monocyte profile. The higher monocyte yields isolated from PBMCs of CeD patients versus control individuals also reflected the greater proportion of dendritic cells derived from these sources following lipopolysaccharide (LPS)/ peptic-tryptic-gliadin (PTG) fragment stimulation. Cell surface markers of CeD monocytes and MoDCs were subsequently profiled. This foremost study identified a novel bio-profile characterised by elevated CD64 and reduced CD33 levels, unique to CD14++ monocytes of CeD patients. Normalisation to LPS stimulation revealed the increased sensitivity of CeD-MoDCs to PTG, as shown by CD86 and HLA-DQ flow cytometric readouts. Enhanced CD86 and HLA-DQ expression in CeD-MoDCs were revealed by confocal microscopy. Analysis highlighted their dominance at the CeD-MoDC membrane in comparison to controls, reflective of superior antigen presentation ability. In conclusion, this investigative study deciphered the monocytes and MoDCs of CeD patients with the identification of a novel bio-profile marker of potential diagnostic value for clinical interpretation. Herein, the characterisation of CD86 and HLA-DQ as activators to stimulants, along with robust membrane assembly reflective of efficient antigen presentation, offers CeD targeted therapeutic avenues worth further exploration.

Keywords: CD33; CD64; CD86; MHCDQ; autoimmunity; major histocompatibility complex II; monocyte; monocyte-derived dendritic cells.


Conflict of interest statement

The authors declare no conflict of interest.

Figures

Figure 1
Figure 1
High prevalence of CeD in the Czech Republic with study participants representing auto immune disease susceptibility across familial generations. (A) Horizontal histograms representing the percentage prevalence of CeD in various European countries. Data sourced from WGO (https://www.worldgastroenterology.org/guidelines, accessed on 12 June 2021) with modifications [20]. Inset map of European countries showing the occurrence of CeD per their respective total populations. (B) Pedigree overview of three families (left: F-A; middle: F-B; right: F-C) whose members participated in this study. Individuals affected by CeD (red), autoimmune inflammation of the thyroid gland (grey), both CeD and autoimmune inflammation of the thyroid gland (red-grey) or non-affected controls (white). (C) Pie chart depicting the types of allergens afflicting the study participants. (D) Table summarising the sex, age, CeD occurrence and manifestation age in family members participating in this study. Antigen positivity to gliadin or autoimmune inflammation of the thyroid gland (AITG) in some family members were indicated. Two participants elicited antigen positivity towards thyroid peroxidase antibody (TPO-ab).
Figure 2
Figure 2
Differential expression of transmembrane markers indicates monocytes extracted from CeD patients have the ability to transform into dendritic cells after exposure to gliadin and lipopolysaccharide. (A) Representative schematic (left) and light microscope images of monocytes (right, upper) extracted from CeD peripheral mononuclear cells (PBMCs). Following exposure to lipopolysaccharide (LPS) or peptic-tryptic-gliadin (PTG) fragments, monocytes differentiated into monocyte-derived dendritic cells (MoDCs; Schematic (left), representative images (right, lower)). Images taken at 10× magnification; scale bar 100 μm. Inset images acquired at 40× magnification; scale bar 25 μm. (B) Dot plots indicating side scatter (SSC) versus forward scatter (FSC) profiles for CeD monocytes (upper) or MoDCs (lower). Gating demarcates the percentage recovery of monocytes from peripheral mononuclear cells (upper) or transformation efficiency to MoDCs post 24 h exposure to LPS/PTG (lower). (C) Histograms showing the significant difference in the proportional percentage of monocytes extracted from PBMCs (upper) and transformed MoDCs (lower) from healthy controls (CTL) and celiac disease patients (CeD). Asterisk (*) or asterisks (**) represent statistical significance at p < 0.05 or p < 0.005 respectively. (D) Representative dot plot showing predominance of CD14++, CD16- monocytes in CeD PBMCs (upper) or CD11c+, CD86+ MoDCs (lower). Numbers indicate percentage of CD16+ and/or CD14+ surface markers on monocytes (upper) or CD11c+, CD86+ MoDCs (lower), respectively. (E) Forward scatter dot plots of monocytes (black gate) or MoDCs (orange gate) differentially expressing surface markers CD14, CD86, CD11c or HLA-DQ. Logarithmic scale provided (right). (F) Histograms showing significant difference in the mean fluorescence intensity for CD14, CD86, CD11c or HLA-DQ between monocytes (Mo) and MoDCs. Asterisks (**) represent statistical significance at p < 0.005.
Figure 3
Figure 3
CeD defined by the identification of a novel bio-profile marker CD33 CD64++ and hyper-sensitivity to gliadin activation. (A) Curved flow cytometric histograms (CFCH) reveal the lower or higher expression of CD14++ monocyte surface markers CD33 (left) or CD64 (middle), respectively, in CeD patients versus healthy controls (CTL). Insets represent the mean fluorescence intensities as arbitrary units (A.U.) for the combined CD33: CD14++ (left) or CD64: CD14++ profile for CTL versus CeDs. Percentage scale bar shown. Histograms represent the highly significant fold difference between CD33 and CD64 levels in CeD patients when normalised to those found in CTL (dashed line). Asterisks (*, ** or ***) represent statistical significance at p < 0.05, p < 0.005 or p < 0.0005 respectively. (B,C) CFCH and insets show expression of MoDC surface marker CD86 (B) or HLA-DQ (C) to gliadin (green) compared to LPS (grey) in CeD (left) versus CTL (middle). Scale represents cellular population levels or mean fluorescence intensity A.U. Histograms underscore the highly significant increased sensitivity of CeD (red) versus CTL (black) to gliadin activation (right). Asterisk (*) represent statistical significance at p < 0.05.
Figure 4
Figure 4
Superior CD86 presentation in MoDCs from CeD patients compared to CTL. (A,B) Representative confocal micrographs of CD86 expression in MoDCs originating from CeD (CeD–MoDCs) patients (A) or CTL (B). Note the predominance of CD86 localised to the surface of CeD-MoDCs compared to CTL samples (green, white arrowheads). Scale bar 10 μm. Inset showing an overview of an individual MoDC transected (dashed line) for fluorescence intensity profile determination. Scale bar 5 μm. Nucleus stained with DAPI (blue). (C) Fluorescence intensity profile of MoDCs transected in insets (A and B). Black arrowheads indicate CD86 detected at the MoDC surface membranes of CeD and control (CTL) samples. (D,E) Histograms showing the mean fluorescence intensity (MFI) as arbitrary units for CD86 in the membrane (D) or cytosolic (E) regions of MoDCs from CeD or CTLs. Asterisks (**) represent statistical significance at p < 0.005.
Figure 5
Figure 5
Robust HLA-DQ membrane expression in MoDCs from CeD patients compared to CTL. (A,B) Representative confocal micrographs of HLA-DQ expression in MoDCs originating from CeD (CeD–MoDCs) patients (A) or CTL (B). Note the high expression levels of HLA-DQ localised to the surface of CeD-MoDCs compared to CTL samples (red, white arrows). Scale bar 5 μm. Inset showing an overview of an individual MoDC transected (dashed line) for fluorescence intensity profile determination. Scale bar 20 μm. Nucleus stained with DAPI (blue). (C) Fluorescence intensity profile of MoDCs transected in insets (A,B). Black arrowheads indicate HLA-DQ detected at the MoDC surface membranes of CeD and CTL samples. (D,E) Histograms showing the mean fluorescence intensity (MFI) as arbitrary units for HLA-DQ in the membrane (D) or cytosol (E) of MoDCs from CTL or CeD. Asterisks (***) represent statistical significance at p < 0.0005.

Similar articles

Cited by

References

    1. Lundin K.E., Wijmenga C. Coeliac disease and autoimmune disease-genetic overlap and screening. Nat. Rev. Gastroenterol. Hepatol. 2015;12:507–515. doi: 10.1038/nrgastro.2015.136. - DOI - PubMed
    1. Shiina T., Hosomichi K., Inoko H., Kulski J.K. The HLA genomic loci map: Expression, interaction, diversity and disease. J. Hum. Genet. 2009;54:15–39. doi: 10.1038/jhg.2008.5. - DOI - PubMed
    1. Zajacova M., Kotrbova-Kozak A., Cerna M. HLA-DRB1, -DQA1 and -DQB1 genotyping of 180 Czech individuals from the Czech Republic pop 3. Hum. Immunol. 2016;77:365–366. doi: 10.1016/j.humimm.2016.02.003. - DOI - PubMed
    1. Lebwohl B., Sanders D.S., Green P.H.R. Coeliac disease. Lancet. 2018;391:70–81. doi: 10.1016/S0140-6736(17)31796-8. - DOI - PubMed
    1. Maki M., Collin P. Coeliac disease. Lancet. 1997;349:1755–1759. doi: 10.1016/S0140-6736(96)70237-4. - DOI - PubMed

MeSH terms