

A Novel UPLC-MS/MS Method Identifies Organ-Specific Dipeptide Profiles
- PMID: 34576148
- PMCID: PMC8465603
- DOI: 10.3390/ijms22189979
A Novel UPLC-MS/MS Method Identifies Organ-Specific Dipeptide Profiles
Abstract
Background: Amino acids have a central role in cell metabolism, and intracellular changes contribute to the pathogenesis of various diseases, while the role and specific organ distribution of dipeptides is largely unknown.
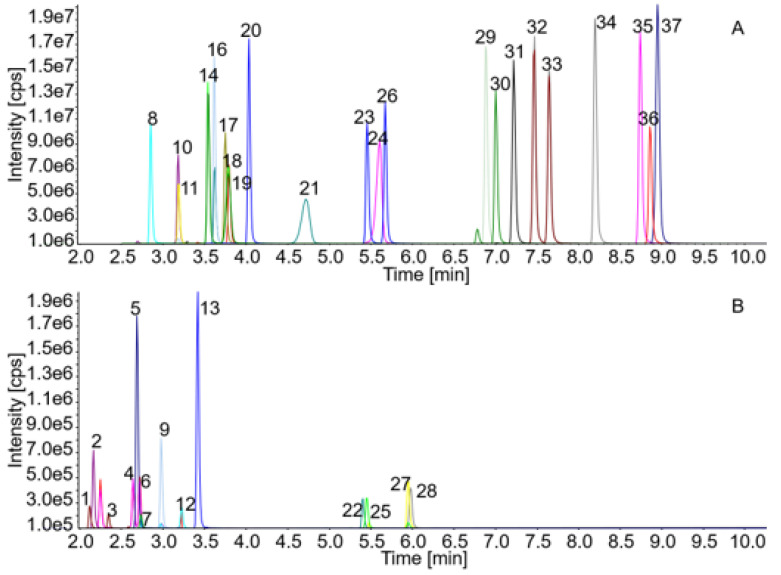
Method: We established a sensitive, rapid and reliable UPLC-MS/MS method for quantification of 36 dipeptides. Dipeptide patterns were analyzed in brown and white adipose tissues, brain, eye, heart, kidney, liver, lung, muscle, sciatic nerve, pancreas, spleen and thymus, serum and urine of C57BL/6N wildtype mice and related to the corresponding amino acid profiles.
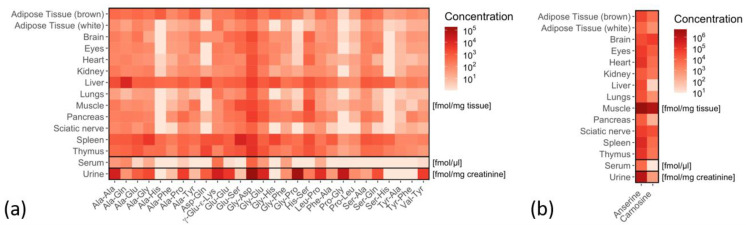
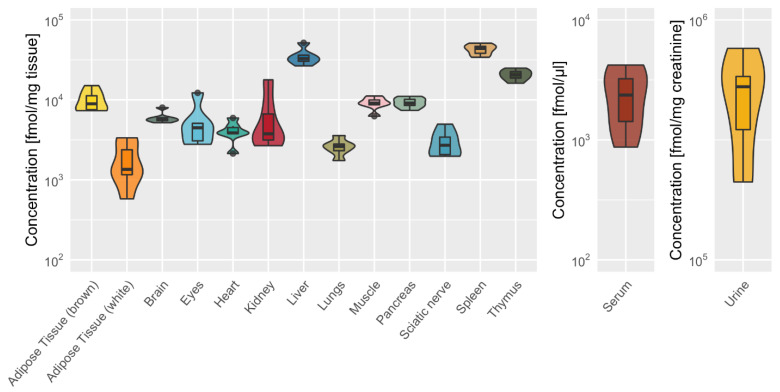
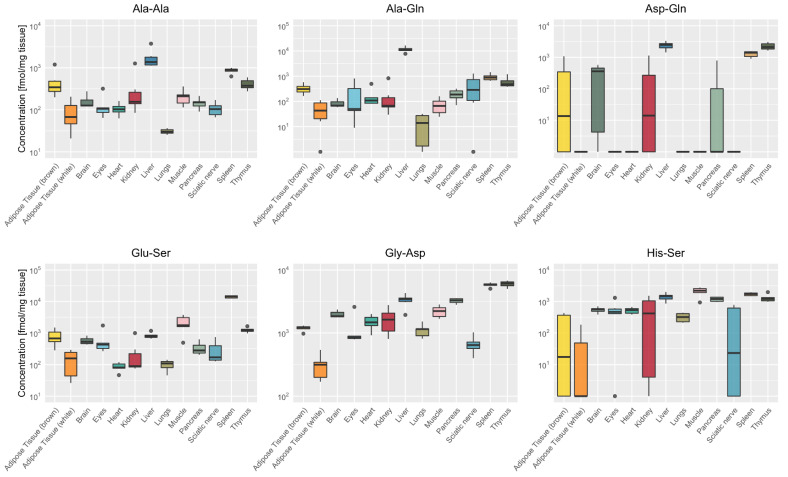
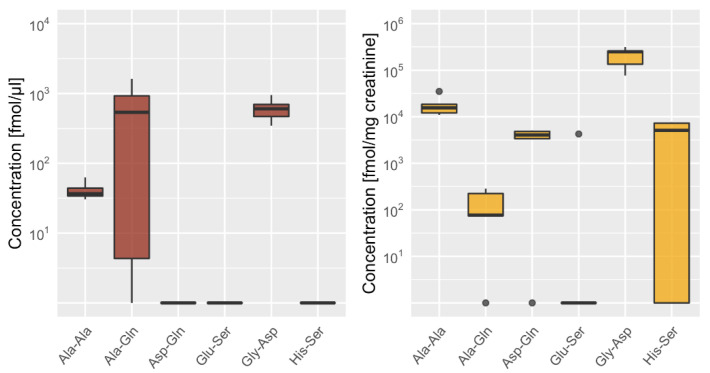
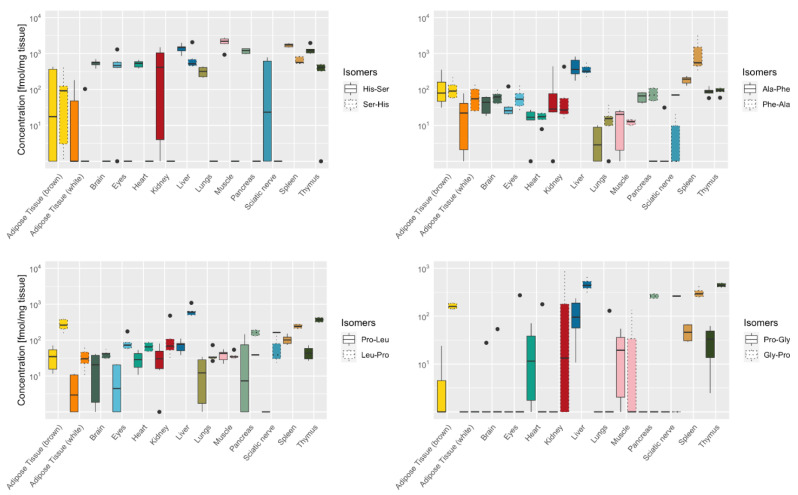
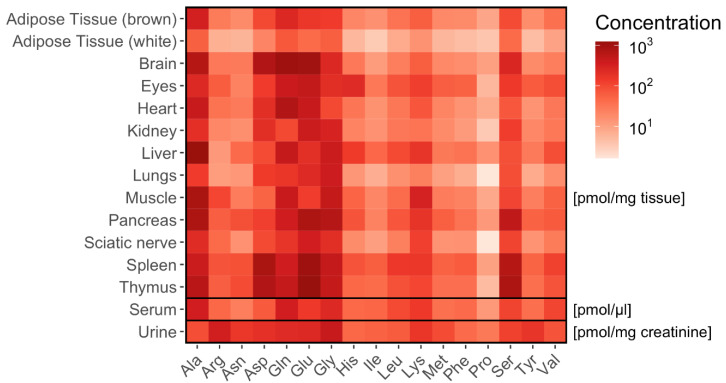
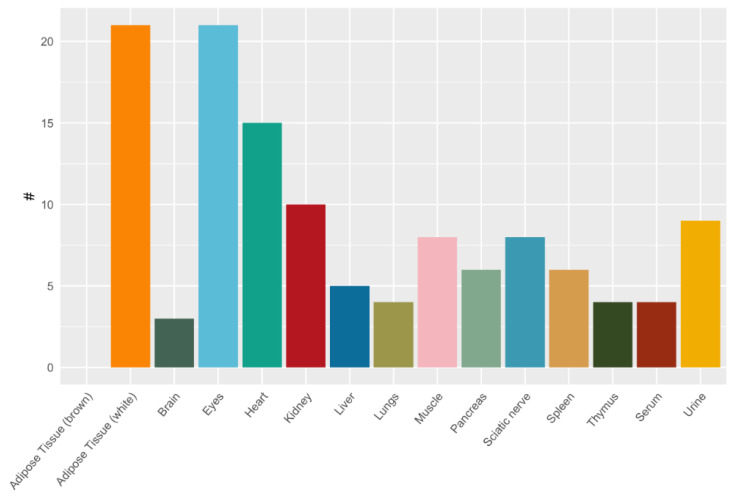
Results: A total of 30 out of the 36 investigated dipeptides were detected with organ-specific distribution patterns. Carnosine and anserine were most abundant in all organs, with the highest concentrations in muscles. In liver, Asp-Gln and Ala-Gln concentrations were high, in the spleen and thymus, Glu-Ser and Gly-Asp. In serum, dipeptide concentrations were several magnitudes lower than in organ tissues. In all organs, dipeptides with C-terminal proline (Gly-Pro and Leu-Pro) were present at higher concentrations than dipeptides with N-terminal proline (Pro-Gly and Pro-Leu). Organ-specific amino acid profiles were related to the dipeptide profile with several amino acid concentrations being related to the isomeric form of the dipeptides. Aspartate, histidine, proline and serine tissue concentrations correlated with dipeptide concentrations, when the amino acids were present at the C- but not at the N-terminus.
Conclusion: Our multi-dipeptide quantification approach demonstrates organ-specific dipeptide distribution. This method allows us to understand more about the dipeptide metabolism in disease or in healthy state.
Keywords: UPLC; biofluids; dipeptides; mass spectrometry; metabolism; tissue.
Conflict of interest statement
The authors declare no conflict of interest.
Figures
Similar articles
-
Dipeptides in CSF and plasma: diagnostic and therapeutic potential in neurological diseases.Amino Acids. 2024 Dec 13;57(1):2. doi: 10.1007/s00726-024-03434-1. Amino Acids. 2024. PMID: 39673003 Free PMC article.
-
Influence of molecular structure on half-life and hydrolysis of dipeptides in plasma: importance of glycine as N-terminal amino acid residue.Metabolism. 1986 Sep;35(9):830-6. doi: 10.1016/0026-0495(86)90224-6. Metabolism. 1986. PMID: 3747839
-
Characterization of Nα-Fmoc-protected dipeptide isomers by electrospray ionization tandem mass spectrometry (ESI-MS(n)): effect of protecting group on fragmentation of dipeptides.Rapid Commun Mass Spectrom. 2011 Jul 30;25(14):1949-58. doi: 10.1002/rcm.5076. Rapid Commun Mass Spectrom. 2011. PMID: 21698678
-
Proteinogenic dipeptides, an emerging class of small-molecule regulators.Curr Opin Plant Biol. 2023 Oct;75:102395. doi: 10.1016/j.pbi.2023.102395. Epub 2023 Jun 11. Curr Opin Plant Biol. 2023. PMID: 37311365 Review.
-
Characterization and design of dipeptide media formulation for scalable therapeutic production.Appl Microbiol Biotechnol. 2025 Jan 14;109(1):7. doi: 10.1007/s00253-024-13402-0. Appl Microbiol Biotechnol. 2025. PMID: 39808320 Free PMC article. Review.
Cited by
-
Regional Brain Analysis of Modified Amino Acids and Dipeptides during the Sleep/Wake Cycle.Metabolites. 2021 Dec 27;12(1):21. doi: 10.3390/metabo12010021. Metabolites. 2021. PMID: 35050142 Free PMC article.
-
Dipeptides in CSF and plasma: diagnostic and therapeutic potential in neurological diseases.Amino Acids. 2024 Dec 13;57(1):2. doi: 10.1007/s00726-024-03434-1. Amino Acids. 2024. PMID: 39673003 Free PMC article.
-
Drug-Based Lifespan Extension in Mice Strongly Affects Lipids Across Six Organs.Aging Cell. 2025 May;24(5):e14465. doi: 10.1111/acel.14465. Epub 2025 Mar 24. Aging Cell. 2025. PMID: 40129070 Free PMC article.
-
Mapping protein-metabolite interactions in E. coli by integrating chromatographic techniques and co-fractionation mass spectrometry.iScience. 2025 May 8;28(6):112611. doi: 10.1016/j.isci.2025.112611. eCollection 2025 Jun 20. iScience. 2025. PMID: 40491478 Free PMC article.
References
-
- Spanier B., Rohm F. Proton coupled oligopeptide transporter 1 (pept1) function, regulation, and influence on the intestinal homeostasis. Compr. Physiol. 2018;8:843–869. - PubMed
MeSH terms
Substances
Grants and funding
LinkOut - more resources
Full Text Sources
