. 2021 Sep 16;22(18):9998.
doi: 10.3390/ijms22189998.

TAR RNA Mediated Folding of a Single-Arginine-Mutant HIV-1 Tat Protein within HeLa Cells Experiencing Intracellular Crowding

Affiliations

TAR RNA Mediated Folding of a Single-Arginine-Mutant HIV-1 Tat Protein within HeLa Cells Experiencing Intracellular Crowding

Jung Min Kim et al. Int J Mol Sci. .

Abstract

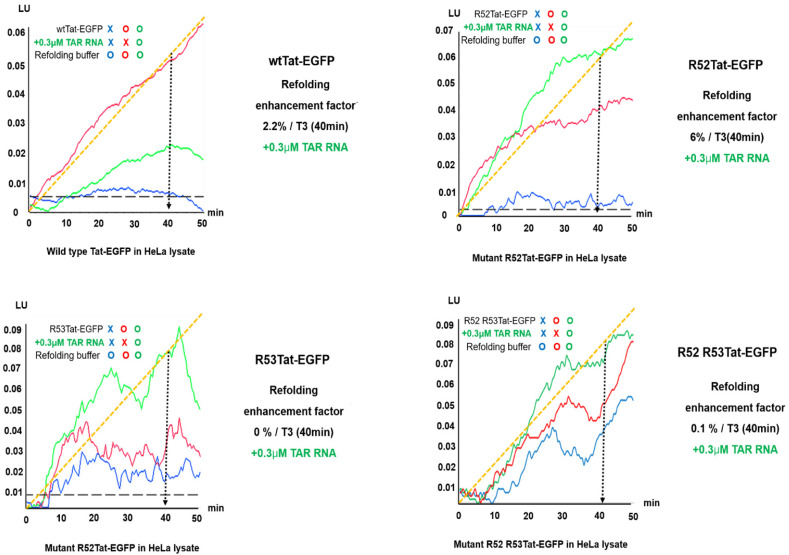
The various effects of native protein folding on the stability and folding rate of intrinsically disordered proteins (IDPs) in crowded intracellular environments are important in biomedicine. Although most studies on protein folding have been conducted in vitro, providing valuable insights, studies on protein folding in crowded intracellular environments are scarce. This study aimed to explore the effects of intracellular molecular crowding on the folding of mutant transactivator HIV-1 Tat based on intracellular interactions, including TAR RNA, as proof of the previously reported chaperna-RNA concept. Considering that the Tat-TAR RNA motif binds RNA, we assessed the po tential function of TAR RNA as a chaperna for the refolding of R52Tat, a mutant in which the argi nine (R) residues at R52 have been replaced with alanine (A) by site-directed mutagenesis. We mon itored Tat-EGFP and Tat folding in HeLa cells via time-lapse fluorescence microscopy and biolayer interferometry using EGFP fusion as an indicator for folding status. These results show that the refolding of R52A Tat was stimulated well at a 0.3 μM TAR RNA concentration; wild-type Tat refolding was essentially abolished because of a reduction in the affinity for TAR RNA at that con centration. The folding and refolding of R52Tat were mainly promoted upon stimulation with TAR RNA. Our findings provide novel insights into the therapeutic potential of chaperna-mediated fold ing through the examination of as-yet-unexplored RNA-mediated protein folding as well as viral genetic variants that modulate viral evolutionary linkages for viral diseases inside a crowded intra cellular environment.

Keywords: TAR RNA; Tat; arginine-rich domains; chaperna; crowding effects; folding kinetics.


Conflict of interest statement

The authors declare no conflict of interest.

Figures

Figure 1
Figure 1
The TAR RNA sequence and chaperna for a single-arginine residue mutant Tat refolding. This figure shows TAR RNA as a molecular chaperone for mutant Tat protein. Tat binds to TAR, which is a highly structured element that is ‘folding competent’ and that specifically interacts with arginine residues. The TAR RNA sequence originates from the complete genome of HIV-1. It comprises 57 base pairs and a stem–loop structure. Two selected arginine residues, R52 and R53, were each selected from the HIV Tat protein for single-point mutation by substitution with alanine. All the mutants of Tat can interact with cellular factors—e.g., cyclin T1 (pink) and P-TEFb (blue)—and can be further regulated by its TAR RNA.
Figure 2
Figure 2
Kinetic refolding of EGFP as a folding reporter under crowded or uncrowded conditions. The effect of refolding at different TAR RNA concentrations on the EGFP (green line) from HeLa lysate and the EGFP (green line) from E. coli was analyzed. (A) The EGFP intensity of refolding in uncrowded conditions was measured from EGFP refolding at specific concentrations (0.3, 3, and 6 µM) of TAR RNA for 25 min (E. coli), with a refolding time of 10 min. (B) The effects of uncrowded conditions compared with the effects of crowded conditions on the GFP intensity were measured based on EGFP refolding at specific concentrations (0.3, 3, and 6 µM) of TAR RNA for 80 min (HeLa lysate), with a refolding time of 40 min. The fluorescence intensity of the EGFP emission is given in relative light units (LU).
Figure 3
Figure 3
Comparative kinetic analysis of the refolding of mutants R52, R53, and R52R53Tat-EGFP in the presence of TAR RNA. The refolding enhancing factor was measured via the fluorescence of wild-type/mutant R52Tat–EGFP in the presence of 0.3 μM TAR RNA in HeLa lysates. The increase in the fluorescence intensity of EGFP was monitored by the time-dependent increases in the fluorescence of wild-type Tat-EGFP and mutant Tat-EGFP. In the presence of 0.3 µM TAR, it was possible to observe refolding enhancement factors over the time course of the fluorescence intensity. A refolding enhancing factor for R52Tat fusion EGFP in the absence or presence of TAR RNA in 0.3 µM HeLa cell lysate of ~6% at 40 min is shown by the green line. Refolding enhancing factors of R53 and R52R53Tat fusion EGFP in the absence or presence of TAR RNA in 0.3 µM HeLa cell lysate of ~1% and 0% at 40 min are shown by the green line. The refolding enhancing factor of wild-type Tat fusion EGFP in the absence or presence of TAR RNA in 0.3 µM HeLa cell lysate of ~2.2% at 40 min is shown by the green line. All the data are the averages of duplicate experiments. Color plots represent the data ranges via linear fitting. EGFP emissions are given in relative light units (LU). Refolding buffer baselines were subtracted from all the data.
Figure 4
Figure 4
Live time-course-dependent changes in fluorescence in mutant Tat folding with TAR RNA in HeLa cells were monitored. The relative proportions of single-arginine-mutant R52 and mutant R53Tat-EGFP expressed in live cells expressing EGFP. Time-dependent increases in R52Tat-EGFP are shown using a scatterplot of the regions of interest (ROIs) corresponding to Videos S1 and S2 of R52 and R53Tat-EGFP fluorescence in the control (blue lines) and TAR RNA co-expressed (red lines) cells. Time-lapse images of R52Tat-EGFP expression in HeLa cells at four independent positions were captured. The mean fluorescence of ROIs was traced using differential interference contrast (DIC) covering the entire numbering field. After transfection and 5 h of incubation, HeLa cells were co-transfected with plasmids encoding mutant R52, R53Tat-EGFP, and TAR RNA and observed under live cell fluorescence microscopy at 10 min intervals for 2 h. (A) Merged images (40X, left) of the DIC and the fluorescence (EGFP) 3 h after transfection. Graphical presentation of the time-dependent increases in R52Tat-EGFP (linear line) expression in live HeLa cells. (B) Overlaid image (10X) used to generate the numbers of R52Tat-EGFP (linear line)- and R53Tat-EGFP (dot line)-expressing cells 24 h after transfection. All scale bars are 200 µm. (C) Comparison of the time-lapse fluorescence observations of R52 and R53Tat-EGFP expression with TAR RNA (red lines) and without TAR RNA co-expression (blue lines).
Figure 5
Figure 5
Comparative kinetic analysis of refolding using biolayer interferometry with mutant R52Tat in the presence of TAR RNA. The effects of mutant R52Tat on the refolding yield in the presence of 0.3 µM TAR RNA within HeLa lysates. Immobilized His-tagged wild-type and mutant Tat refolding was assessed using an anti-penta-His biosensor on an Octect RED 96 system by monitoring the function of chaperna through a TAR RNA assay in HeLa lysates. A representative BLI color sensogram is shown, indicating a preferential increase in mutant Tat refolding in the presence of TAR RNA (red lines) relative to wild-type Tat refolding, which is related to the hydrophobic surfaces as chaperna progresses. The refolding of wild-type Tat (middle dotted line), TatR52 (solid line), and TatR53 (dotted line) in the absence of TAR RNA (blue lines) and the refolding of wild-type Tat (middle dotted line), TatR52 (solid line), and TatR53 (dot line) in the presence of 0.3 µM TAR RNA (red lines) are shown (specific binding to anti-penta-His; left y-axis). All the data are the average of duplicate experiments. Color plots represent the data range. Buffer baselines were subtracted from all the data.

Similar articles

Cited by

References

    1. Ellis R.J. Macromolecular crowding: Obvious but underappreciated. Trends Biochem. Sci. 2001;26:597–604. doi: 10.1016/S0968-0004(01)01938-7. - DOI - PubMed
    1. van den Berg B., Ellis R.J., Dobson C.M. Effects of macromolecular crowding on protein folding and aggregation. EMBO J. 1999;18:6927–6933. doi: 10.1093/emboj/18.24.6927. - DOI - PMC - PubMed
    1. van den Berg B., Wain R., Dobson C.M., Ellis R.J. Macromolecular crowding perturbs protein refolding kinetics: Implications for folding inside the cell. EMBO J. 2000;19:3870–3875. doi: 10.1093/emboj/19.15.3870. - DOI - PMC - PubMed
    1. Zhou H.X. Influence of crowded cellular environments on protein folding, binding, and oligomerization: Biological consequences and potentials of atomistic modeling. FEBS Lett. 2013;587:1053–1061. doi: 10.1016/j.febslet.2013.01.064. - DOI - PMC - PubMed
    1. Vavouri T., Semple J.I., Garcia-Verdugo R., Lehner B. Intrinsic protein disorder and interaction promiscuity are widely associated with dosage sensitivity. Cell. 2009;138:198–208. doi: 10.1016/j.cell.2009.04.029. - DOI - PubMed

MeSH terms

Substances

LinkOut - more resources