

Can We Predict the Isosymmetric Phase Transition? Application of DFT Calculations to Study the Pressure Induced Transformation of Chlorothiazide
- PMID: 34576265
- PMCID: PMC8465122
- DOI: 10.3390/ijms221810100
Can We Predict the Isosymmetric Phase Transition? Application of DFT Calculations to Study the Pressure Induced Transformation of Chlorothiazide
Abstract
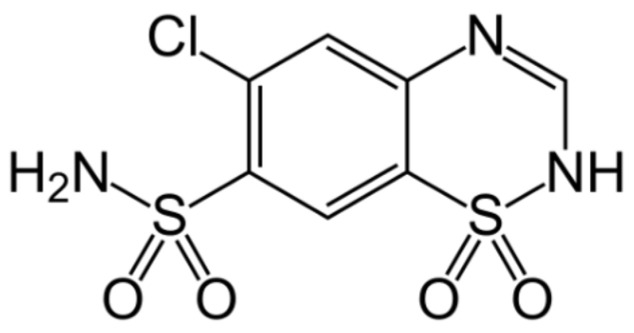
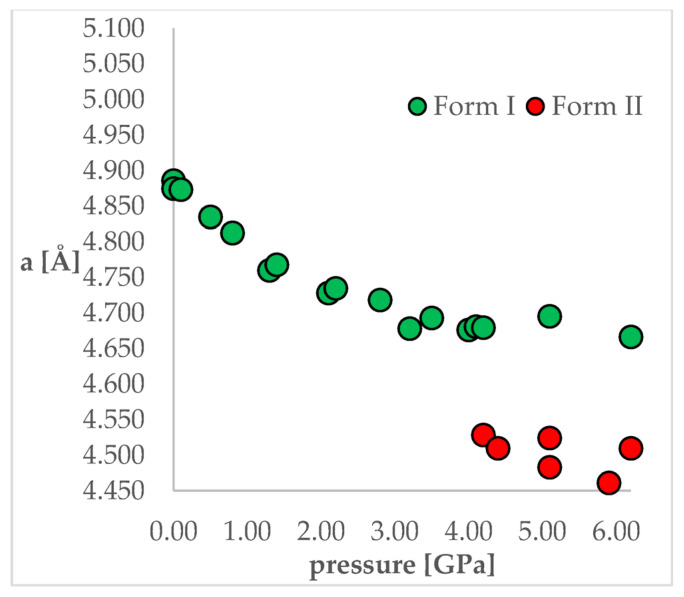
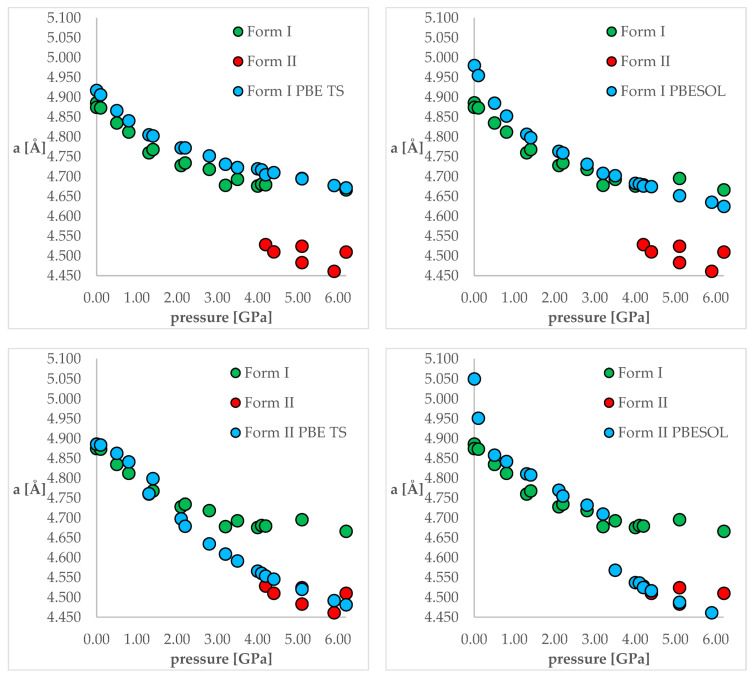
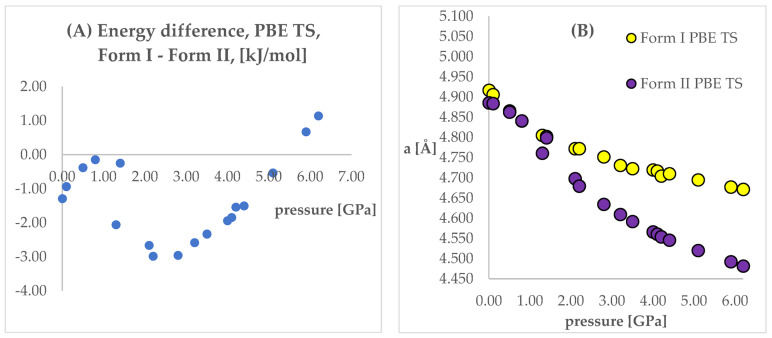
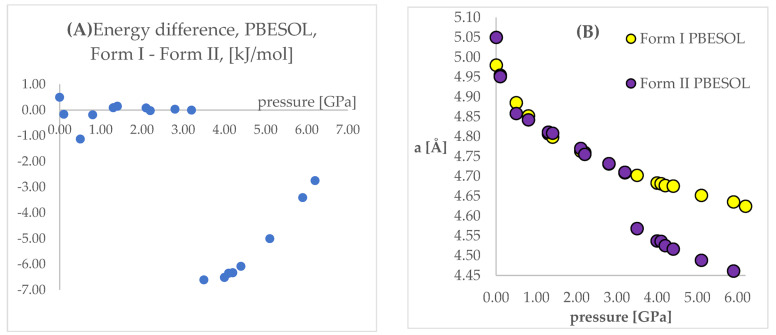
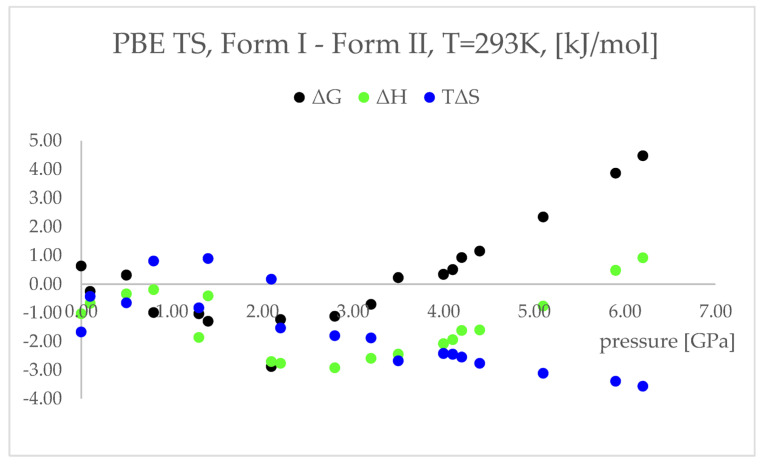
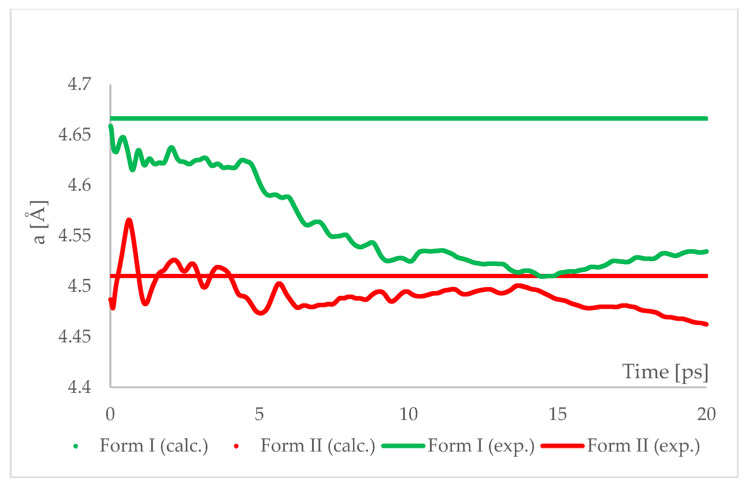
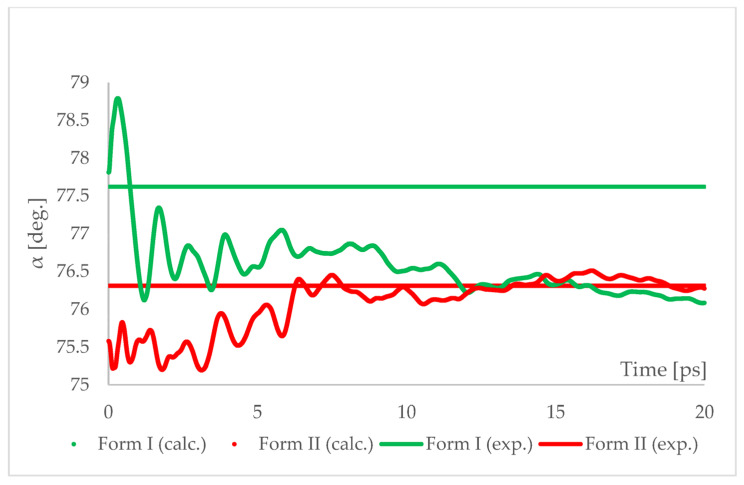
Isosymmetric structural phase transition (IPT, type 0), in which there are no changes in the occupation of Wyckoff positions, the number of atoms in the unit cell, and the space group symmetry, is relatively uncommon. Chlorothiazide, a diuretic agent with a secondary function as an antihypertensive, has been proven to undergo pressure-induced IPT of Form I to Form II at 4.2 GPa. For that reason, it has been chosen as a model compound in this study to determine if IPT can be predicted in silico using periodic DFT calculations. The transformation of Form II into Form I, occurring under decompression, was observed in geometry optimization calculations. However, the reverse transition was not detected, although the calculated differences in the DFT energies and thermodynamic parameters indicated that Form II should be more stable at increased pressure. Finally, the IPT was successfully simulated using ab initio molecular dynamics calculations.
Keywords: CASTEP; DFT; ab initio molecular dynamics; aiMD; phase transition; polymorphism.
Conflict of interest statement
The authors declare no conflict of interest. The funders had no role in the design of the study; in the collection, analyses, or interpretation of data; in the writing of the manuscript, or in the decision to publish the results.
Figures
Similar articles
-
Can We Predict the Pressure Induced Phase Transition of Urea? Application of Quantum Molecular Dynamics.Molecules. 2020 Mar 30;25(7):1584. doi: 10.3390/molecules25071584. Molecules. 2020. PMID: 32235582 Free PMC article.
-
Application of combined solid-state NMR and DFT calculations for the study of piracetam polymorphism.Solid State Nucl Magn Reson. 2019 Feb;97:17-24. doi: 10.1016/j.ssnmr.2018.11.002. Epub 2018 Nov 22. Solid State Nucl Magn Reson. 2019. PMID: 30508738
-
Pressure-induced phase transition in wurtzite ZnTe: an ab initio study.J Mol Model. 2012 Mar;18(3):1167-72. doi: 10.1007/s00894-011-1149-6. Epub 2011 Jun 18. J Mol Model. 2012. PMID: 21681441
-
A Review on Combination of Ab Initio Molecular Dynamics and NMR Parameters Calculations.Int J Mol Sci. 2021 Apr 22;22(9):4378. doi: 10.3390/ijms22094378. Int J Mol Sci. 2021. PMID: 33922192 Free PMC article. Review.
-
Computational studies of crystal structure and bonding.Top Curr Chem. 2012;315:1-32. doi: 10.1007/128_2011_131. Top Curr Chem. 2012. PMID: 21506002 Review.
Cited by
-
Density Functional Theory and Density Functional Tight Binding Studies of Thiamine Hydrochloride Hydrates.Molecules. 2023 Nov 9;28(22):7497. doi: 10.3390/molecules28227497. Molecules. 2023. PMID: 38005219 Free PMC article.
-
Review of Applications of Density Functional Theory (DFT) Quantum Mechanical Calculations to Study the High-Pressure Polymorphs of Organic Crystalline Materials.Int J Mol Sci. 2023 Sep 15;24(18):14155. doi: 10.3390/ijms241814155. Int J Mol Sci. 2023. PMID: 37762459 Free PMC article. Review.
-
Investigation of N-(2-oxo-2H-chromen-3-carbonyl)cytisine's Crystal Structure and Optical Properties.Materials (Basel). 2025 Jul 3;18(13):3153. doi: 10.3390/ma18133153. Materials (Basel). 2025. PMID: 40649642 Free PMC article.
References
MeSH terms
Substances
Grants and funding
LinkOut - more resources
Full Text Sources
