. 2021 Sep 14;14(18):5305.
doi: 10.3390/ma14185305.

Silicon Nanowires: A Breakthrough for Thermoelectric Applications

Affiliations

Silicon Nanowires: A Breakthrough for Thermoelectric Applications

Giovanni Pennelli et al. Materials (Basel). .

Abstract

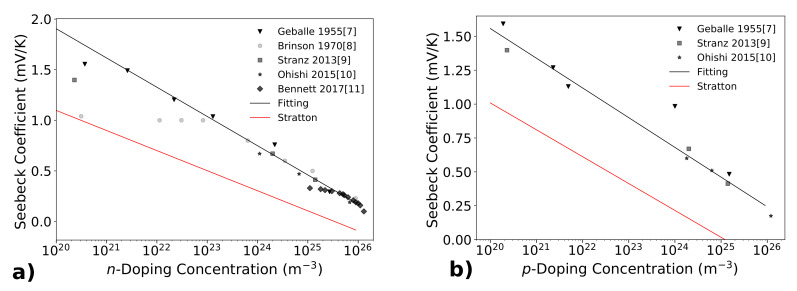
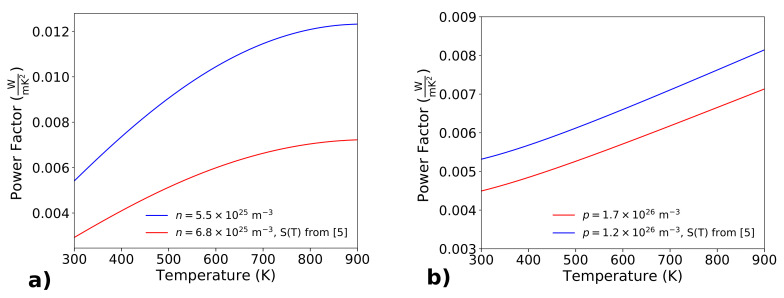
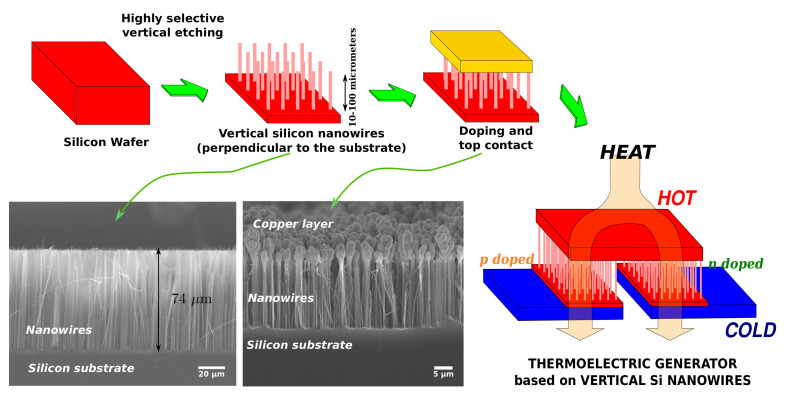
The potentialities of silicon as a starting material for electronic devices are well known and largely exploited, driving the worldwide spreading of integrated circuits. When nanostructured, silicon is also an excellent material for thermoelectric applications, and hence it could give a significant contribution in the fundamental fields of energy micro-harvesting (scavenging) and macro-harvesting. On the basis of recently published experimental works, we show that the power factor of silicon is very high in a large temperature range (from room temperature up to 900 K). Combining the high power factor with the reduced thermal conductivity of monocrystalline silicon nanowires and nanostructures, we show that the foreseen figure of merit ZT could be very high, reaching values well above 1 at temperatures around 900 K. We report the best parameters to optimize the thermoelectric properties of silicon nanostructures, in terms of doping concentration and nanowire diameter. At the end, we report some technological processes and solutions for the fabrication of macroscopic thermoelectric devices, based on large numbers of silicon nanowire/nanostructures, showing some fabricated demonstrators.

Keywords: figure of merit; silicon nanowire; thermal conductivity; thermoelectricity.


Conflict of interest statement

The authors declare no conflict of interest.

Figures

Figure 1
Figure 1
Available experimental data of the Seebeck coefficient are reported both for n-doping (Panel (a)) and for p-doping (Panel (b)). The logarithmic fit (see text) is also shown. The red lines show the Seebeck coefficient calculated with the Stratton formula (both for n and for p doping): experimental measurement give higher values of the Seebeck coefficient. Panel (a) is a modification of the figure published on [14].
Figure 2
Figure 2
The room temperature power factor S2σ is reported as a function of the doping concentration, both for n (Panel (a)) and for p type silicon (Panel (b)). An optimal doping for the maximum power factor is established both for n (n=5.5×1025 m3) and for p (p=1.2×1026 m3) type silicon. Panel (a) has been reprinted from [14] with permission.
Figure 3
Figure 3
The power factor of n (Panel (a)) and p (Panel (b)) doped silicon is reported as a function of temperature. The blue curves concern the doping concentration, which maximizes the power factor at room temperature, the red curves have been calculated considering S=S(T) experimentally determined by Ohishi [12] for doping concentrations different from that for the maximum power factor.
Figure 4
Figure 4
The electrical conductivity for n=5.5×1025 m3, normalized with respect to the bulk value, is reported as a function of the nanowire width (continuous curve). Furthermore, the experimental measurements of the thermal conductivity (scatters) are reported. For diameters between 30 nm and 100 nm (roughly), the electrical conductivity is comparable with that in the bulk, the thermal conductivity results were instead strongly reduced for sufficiently rough nanowires.
Figure 5
Figure 5
The factor Z (Panel (a)) and the figure of merit ZT (Panel (b)) are reported as a function of temperature, for the optimum thermoelectric doping of n type silicon. Different curves consider different values of the thermal conductivity kt. The highest values of Z are related to kt=2 W/(m K), achievable in rough silicon nanowires.
Figure 6
Figure 6
Original SEM micrographs of fabricated prototypes, together with a sketch of these planar thermoelectric devices. These prototypes confirm the feasibility of an all-silicon thermoelectric device, based on large arrays of silicon nanostructures.
Figure 7
Figure 7
Sketches and SEM micrographs of thermoelectric devices based on silicon nanowires fabricated perpendicular to the substrate.

References

    1. Pourkiaei S.M., Ahmadi M.H., Sadeghzadeh M., Moosavi S., Pourfayaz F., Chen L., Pour Yazdi M.A., Kumar R. Thermoelectric cooler and thermoelectric generator devices: A review of present and potential applications, modeling and materials. Energy. 2019;186:115849. doi: 10.1016/j.energy.2019.07.179. - DOI
    1. Caballero-Calero O., Ares R., Martin-Gonzalez M. Environmentally Friendly Thermoelectric Materials: High Performance from Inorganic Components with Low Toxicity and Abundance in the Earth. Adv. Sustain. Syst. 2021:2100095. doi: 10.1002/adsu.202100095. - DOI
    1. Chen L., Meng F., Ge Y., Feng H., Xia S. Performance optimization of a class of combined thermoelectric heating devices. Sci. China Technol. Sci. 2020;63:2640–2648. doi: 10.1007/s11431-019-1518-x. - DOI
    1. Pennelli G. Review of nanostructured devices for thermoelectric applications. Beilstein J. Nanotechnol. 2014;5:1268. doi: 10.3762/bjnano.5.141. - DOI - PMC - PubMed
    1. Pennelli G. Top-down fabrication of silicon nanowire devices for thermoelectric applications: Properties and perspectives. Eur. Phys. J. B. 2015;88:121. doi: 10.1140/epjb/e2015-50638-0. - DOI

LinkOut - more resources