Genome Analysis of Streptomyces nojiriensis JCM 3382 and Distribution of Gene Clusters for Three Antibiotics and an Azasugar across the Genus Streptomyces
- PMID: 34576698
- PMCID: PMC8466323
- DOI: 10.3390/microorganisms9091802
Genome Analysis of Streptomyces nojiriensis JCM 3382 and Distribution of Gene Clusters for Three Antibiotics and an Azasugar across the Genus Streptomyces
Abstract
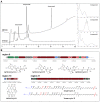
Streptomyces spp. have been major contributors of novel natural products that are used in many application areas. We found that the nojirimycin (NJ) producer JCM 3382 has antimicrobial activity against Staphylococcus aureus via cellular degradation. Genome analysis revealed 30 biosynthetic gene clusters, including those responsible for producing antibiotics, including an azasugar NJ. In-depth MS/MS analysis confirmed the production of 1-deoxynojirimycin (DNJ) along with NJ. In addition, the production of tambromycins, setomimycin, and linearmycins was verified by spectroscopic analyses, including LC-MS and NMR. The distribution of the clusters of genes coding for antibiotics in 2061 Streptomyces genomes suggested potential producers of tambromycin, setomimycin, and linearmycin. For a DNJ gene cluster, homologs of gabT1 and gutB1 were commonly found; however, yktC1 was identified in only 112 genomes. The presence of several types of clusters suggests that different strains may produce different types of azasugars. Chemical-profile-inspired comparative genome analysis may facilitate a more accurate assessment of the biosynthetic potential to produce secondary metabolites.
Keywords: Streptomyces nojiriensis JCM 3382; antibiotics; biosynthetic gene cluster; comparative genomics; nojirimycin; secondary metabolism.
Conflict of interest statement
The authors declare no conflict of interest.
Figures


Similar articles
-
Comparative genomic analysis of azasugar biosynthesis.AMB Express. 2021 Aug 23;11(1):120. doi: 10.1186/s13568-021-01279-5. AMB Express. 2021. PMID: 34424396 Free PMC article.
-
Functional Genome Mining for Metabolites Encoded by Large Gene Clusters through Heterologous Expression of a Whole-Genome Bacterial Artificial Chromosome Library in Streptomyces spp.Appl Environ Microbiol. 2016 Sep 16;82(19):5795-805. doi: 10.1128/AEM.01383-16. Print 2016 Oct 1. Appl Environ Microbiol. 2016. PMID: 27451447 Free PMC article.
-
Comparative Genomic Insights into Secondary Metabolism Biosynthetic Gene Cluster Distributions of Marine Streptomyces.Mar Drugs. 2019 Aug 26;17(9):498. doi: 10.3390/md17090498. Mar Drugs. 2019. PMID: 31454987 Free PMC article.
-
The Application of Regulatory Cascades in Streptomyces: Yield Enhancement and Metabolite Mining.Front Microbiol. 2020 Mar 24;11:406. doi: 10.3389/fmicb.2020.00406. eCollection 2020. Front Microbiol. 2020. PMID: 32265866 Free PMC article. Review.
-
Synthetic Biology Tools for Novel Secondary Metabolite Discovery in Streptomyces.J Microbiol Biotechnol. 2019 May 28;29(5):667-686. doi: 10.4014/jmb.1904.04015. J Microbiol Biotechnol. 2019. PMID: 31091862 Review.
Cited by
-
Analysis of the Setomimycin Biosynthetic Gene Cluster from Streptomyces nojiriensis JCM3382 and Evaluation of Its α-Glucosidase Inhibitory Activity Using Molecular Docking and Molecular Dynamics Simulations.Int J Mol Sci. 2024 Oct 6;25(19):10758. doi: 10.3390/ijms251910758. Int J Mol Sci. 2024. PMID: 39409089 Free PMC article.
-
A peptide encoded by a highly conserved gene belonging to the genus Streptomyces shows antimicrobial activity against plant pathogens.Front Plant Sci. 2023 Oct 5;14:1250906. doi: 10.3389/fpls.2023.1250906. eCollection 2023. Front Plant Sci. 2023. PMID: 37868322 Free PMC article.
-
Insights into the Activities and Usefulness of Deoxynojirimycin and Morus alba: A Comprehensive Review.Molecules. 2025 Jul 31;30(15):3213. doi: 10.3390/molecules30153213. Molecules. 2025. PMID: 40807388 Free PMC article. Review.
-
Genomic Exploration of a Chitinolytic Streptomyces albogriseolus PMB5 Strain from European mantis (Mantis religiosa).Curr Issues Mol Biol. 2024 Aug 24;46(9):9359-9375. doi: 10.3390/cimb46090554. Curr Issues Mol Biol. 2024. PMID: 39329906 Free PMC article.
-
Discovery of 15-deoxynaphthomycins activating the antioxidant NRF2-ARE pathway from Streptomyces sp. N50 via genome mining, global regulator introduction, and molecular networking.Microb Cell Fact. 2025 Jan 10;24(1):14. doi: 10.1186/s12934-024-02641-5. Microb Cell Fact. 2025. PMID: 39794808 Free PMC article.
References
Grants and funding
LinkOut - more resources
Full Text Sources
Other Literature Sources
Molecular Biology Databases
Research Materials
Miscellaneous

