. 2021 Aug 25;9(9):1803.
doi: 10.3390/microorganisms9091803.

Phytate and Microbial Suspension Amendments Increased Soybean Growth and Shifted Microbial Community Structure

Affiliations

Phytate and Microbial Suspension Amendments Increased Soybean Growth and Shifted Microbial Community Structure

Bulbul Ahmed et al. Microorganisms. .

Abstract

Phytate represents an organic pool of phosphorus in soil that requires hydrolysis by phytase enzymes produced by microorganisms prior to its bioavailability by plants. We tested the ability of a microbial suspension made from an old growth maple forest's undisturbed soil to mineralize phytate in a greenhouse trial on soybean plants inoculated or non-inoculated with the suspension. MiSeq Amplicon sequencing targeting bacterial 16S rRNA gene and fungal ITS was performed to assess microbial community changes following treatments. Our results showed that soybean nodulation and shoot dry weight biomass increased when phytate was applied to the nutrient-poor substrate mixture. Bacterial and fungal diversities of the root and rhizosphere biotopes were relatively resilient following inoculation by microbial suspension; however, bacterial community structure was significantly influenced. Interestingly, four arbuscular mycorrhizal fungi (AMF) were identified as indicator species, including Glomus sp., Claroideoglomus etunicatum, Funneliformis mosseae and an unidentified AMF taxon. We also observed that an ericoid mycorrhizal taxon Sebacina sp. and three Trichoderma spp. were among indicator species. Non-pathogenic Planctobacteria members highly dominated the bacterial community as core and hub taxa for over 80% of all bacterial datasets in root and rhizosphere biotopes. Overall, our study documented that inoculation with a microbial suspension and phytate amendment improved soybean plant growth.

Keywords: MiSeq; microbiome; network; phosphorus; phytate; soybean.


Conflict of interest statement

There is no conflict of interests among the authors.

Figures

Figure 1
Figure 1
Measures of plant biomass, nodulation and total phosphorus, and microbial community structure. (A) Dry weight (g) of shoot and root. Green boxplots represent shoot dry weight, and grey boxplots represent root dry weight; (B) number of nodules per plant and total phosphorus measured in shoots. With each treatment group, means with the same letter are not significantly different by a Tukey’s range test. M1P1 = presence of both microbial inoculum and phytate; M1P0 = only microbial inoculum; M0P1 = only phytate, and M0P0 = absence of both microbial inoculum and phytate. (C) Shannon and Simpson diversity for bacterial microbiota; (D) Shannon and Simpson diversity for fungal microbiota. M1P1 = presence of both microbial inoculum and phytate; M1P0 = only microbial inoculum; M0P1 = only phytate, and M0P0 = absence of both microbial inoculum and phytate. Principal coordinates analysis (PCoA) showing the community compositions assignments of (E) bacterial 16S r RNA genes and (F) fungal ITS genes data. The variation shown in axes 1 and 2 of the ordinations is indicated in parenthesis. Circular and triangle shape represents samples from rhizosphere soil and root, respectively. Each colour represents a sample. M1P1 = microbial inocula and phytate; M1P0 = only microbial inocula; M0P1 = phytate only and M0P0 = absence of both microbial inocula and phytate.
Figure 2
Figure 2
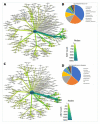
Taxonomic hierarchy and associated observations of ASVs (taxmap) for bacterial communities. Taxmap at order level in root (A) and relative abundance of top 10 orders in root (B). Taxmap at order level in rhizosphere (C) and relative abundance of top 10 orders in rhizosphere biotope (D).
Figure 3
Figure 3
Bacterial indicator species of soybean microbiome at the genus level. The most representative species of the soybean microbiome were identified through indicator species analysis. Bacterial indicator species under inoculum treatment in root (A) and in rhizosphere (B) biotopes; and under phytate treatment in root (C) and in rhizosphere (D).
Figure 4
Figure 4
Fungal indicator species of soybean microbiome at the genus level. The most representative species of soybean microbiome were identified through indicator species analysis. Fungal indicator species in rhizosphere biotope under inoculum treatment (A) and under phytate treatment (B). The number of ASVs is indicated by the number within each taxon.
Figure 5
Figure 5
Taxonomic hierarchy (taxmap) and associated observations of ASVs (taxmap) for fungal communities. Taxmap at order level in root (A) and relative abundance of top 10 orders in root (B). Taxmap at order level in rhizosphere (C) and relative abundance of top 10 orders in rhizosphere biotope (D).
Figure 6
Figure 6
Network analysis in soybean microbiome. Inter-kingdom network in the root (A) and rhizosphere (B) biotopes. The node shapes represent bacterial (circular) and fungal (rhombus) communities. Nodes are coloured according to the relative abundance of the corresponding ASVs. The ribbon shows the relative complexity of the inter-kingdom network in root and rhizosphere biotopes. (C) A network build from ASVs of hub taxa and their inter-connection clustered into eight different modules. Each node represents an ASV from the microbiome. Green link represents a positive interaction and red link represents a negative interaction. Nodes are coloured according to the relative abundance of the corresponding ASVs, and node shapes denote bacterial (circular) and fungal (rhombus) ASVs. Details of the ASVs corresponding global hub taxa are in Table S10.

Similar articles

Cited by

References

    1. Plaxton W.C., Tran H.T. Metabolic adaptations of phosphate-starved plants. Plant Physiol. 2011;156:1006–1015. doi: 10.1104/pp.111.175281. - DOI - PMC - PubMed
    1. FAO . World Fertilizer Trends and Outlook to 2020: Summary Report. FAO; Rome, Italy: 2017.
    1. Geissler B., Mew M.C., Steiner G. Phosphate supply security for importing countries: Developments and the current situation. Sci. Total Environ. 2019;677:511–523. doi: 10.1016/j.scitotenv.2019.04.356. - DOI - PubMed
    1. Obersteiner M., Peñuelas J., Ciais P., van der Velde M., Janssens I.A. The phosphorus trilemma. Nat. Geosci. 2013;6:897–898. doi: 10.1038/ngeo1990. - DOI
    1. Jarosch K.A., Kandeler E., Frossard E., Bünemann E. Is the enzymatic hydrolysis of soil organic phosphorus compounds limited by enzyme or substrate availability? Soil Biol. Biochem. 2019;139:107628. doi: 10.1016/j.soilbio.2019.107628. - DOI

LinkOut - more resources